
Figure 4.
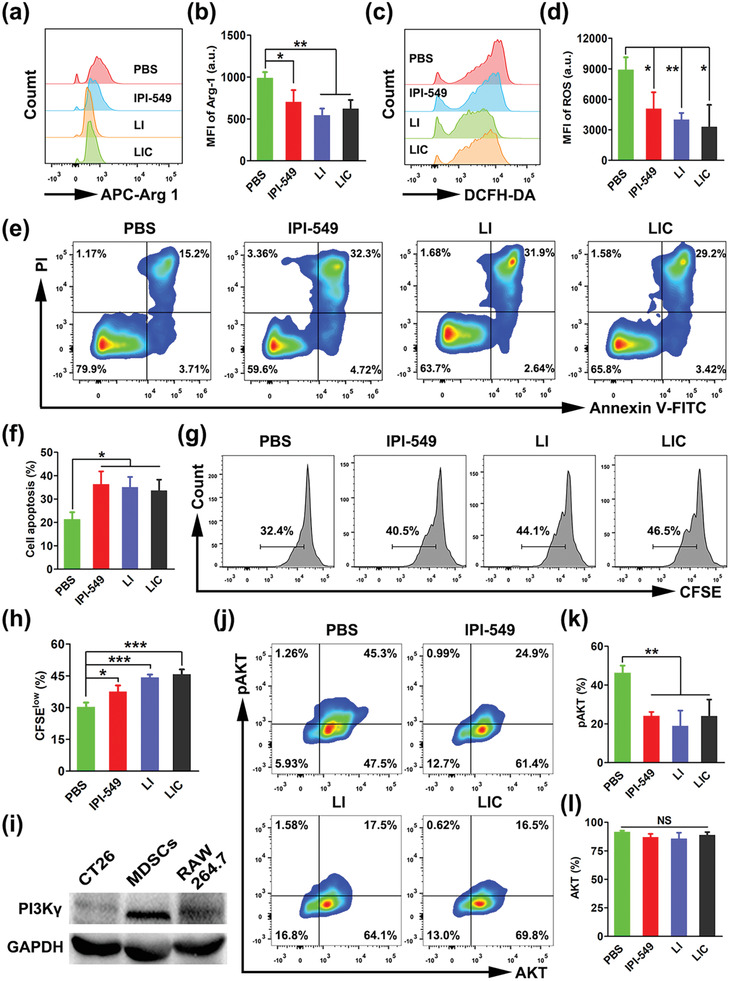
Suppression of MDSCs through PI3Kγ‐AKT signaling pathway inhibition with IPI‐549‐based nanodrugs in vitro. a) Arg‐1 expression determined by flow cytometry and b) statistical analysis of proportions of Arg‐1 expression in MDSCs receiving various treatments (n = 3). c) ROS levels determined by flow cytometry and d) statistical analysis of proportions of ROS levels in MDSCs receiving various treatments (n = 3). e) Cell apoptosis determined by flow cytometry and f) statistical analysis of apoptotic rates in MDSCs receiving different treatments (n = 3). g) Proliferation of CD8+ T cells determined by flow cytometry analysis and h) statistical analysis of proliferation rates of CD8+ T cells after being cultured together with nanodrug‐pretreated MDSCs (n = 3). i) PI3Kγ expression determined by western blot analysis. j) Quantification of pAKT and total AKT expressions by flow cytometry and k,l) statistical analysis of percentages of pAKT and total AKT expression in MDSCs receiving various treatments (n = 3). *p < 0.05, **p < 0.01, ***p < 0.001, NS: no significant difference.