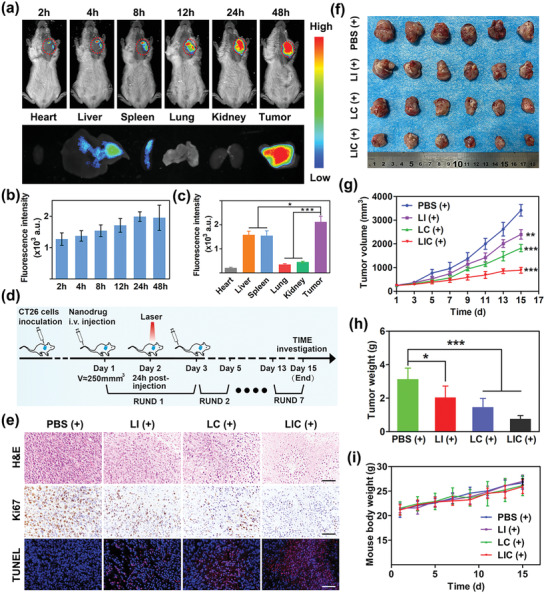
Figure 5.

In vivo fluorescence imaging and synergistic antitumor therapy of nanodrugs. a) In vivo fluorescence imaging of CT26 tumor‐bearing mice at different time points after tail vein injection of DiR‐labeled LIC and ex vivo fluorescence imaging of main organs and tumor at 48 h after injection. b) Quantification of in vivo fluorescence intensity of tumors at different time points after injection (n = 3). c) Comparison of fluorescence intensities between major organs and tumor excised at 48 h after injection (n = 3). d) Schematic illustration of therapeutic strategy in animal model. e) Photograph of tumors excised from mice receiving various treatments. Scale bar: 50 µm. g) Tumor growth curves for mice receiving different treatments (n = 6). Data are shown as mean ± standard error of mean (SEM). h) Tumor weights in different therapeutic groups and i) changes of body weight during various treatments (n = 6). *p < 0.05, **p < 0.01, ***p < 0.001.
