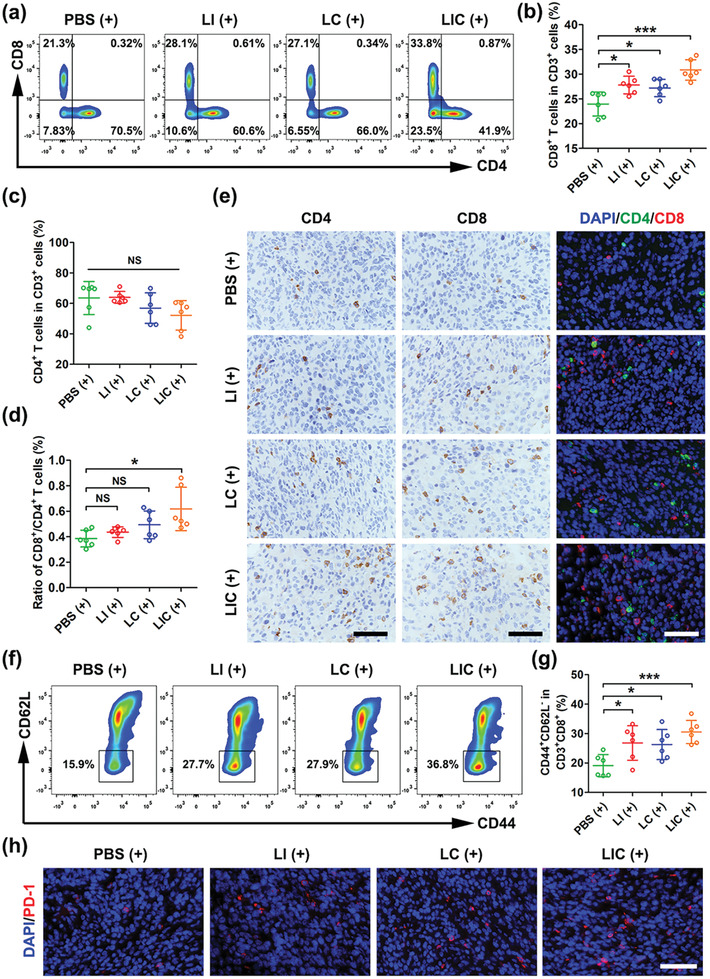
Figure 6.

Nanodrugs enhanced antitumor immune responses in CT26 tumor. a) CD8+ T and CD4+ T cells ratios in tumor tissues determined by flow cytometry after different treatments (gated on CD3+ cells). b) Statistical analysis of the ratio of CD8+ T cells or c) the ratio of the CD4+ T cells to the CD3+ cells in different groups (n = 6). d) Statistical analysis of the ratio of CD8+ T cells to CD4+ T cells in different groups (n = 6). e) Immunohistochemical and immunofluorescent staining of CD4 and CD8 in CT26 tumors after different treatments. Scale bar: 50 µm. f) Representative plots of effector memory T (TEM) cells in spleen after different treatments determined by flow cytometry (gated on CD3+CD8+ T cells). g) Statistical analysis of TEM proportions in CD3+CD8+ T cells in different groups (n = 6). h) Immunofluorescent staining of the nucleus (blue) and PD‐1 expression (red) in CT26 tumors in different groups. Scale bar: 50 µm. *p < 0.05, ***p < 0.001, NS: no significant difference.
