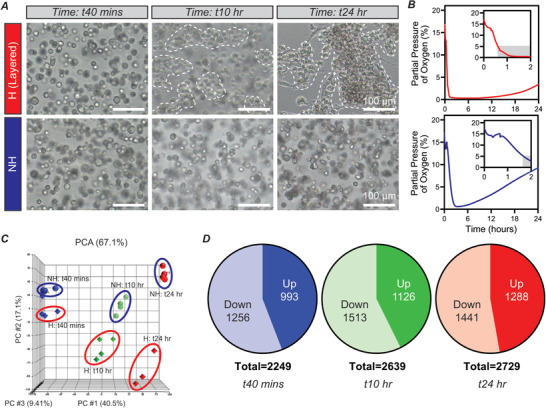
Figure 3.

Differential gene expression between ECFCs encapsulated in layered‐hypoxic and nonhypoxic hydrogels. A) ECFCs encapsulated in layered‐hypoxic hydrogels exhibited cluster formation, while cells in nonhypoxic hydrogels remained isolated as single cells. B) O2 measurements of the layered‐hypoxic hydrogels indicated rapid and sustained exposure to hypoxia. O2 measurements at the bottom of nonhypoxic hydrogels indicated delayed and transient exposure to hypoxia. C) PCA identifies three PCs contribute to 67.1% of the variance in the data. Biological replicates for each condition (hypoxic vs nonhypoxic) cluster together at each time points. Outliers, as identified by statistical analysis, were omitted from subsequent analysis. n = 3–4 for each condition at each time point. D) Statistically significantly differentially expressed genes in hypoxic versus nonhypoxic conditions at each time point, as identified by 1‐way ANOVA. All scale bars: 100 µm.
