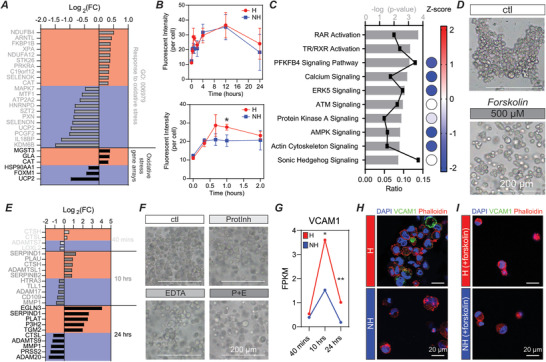
Figure 4.

Analysis and confirmation of RNA‐sequencing data reveals the role of ROS and oxidative stress, cAMP signaling, matrix degradation by proteases, and the role of VCAM‐1 in cluster formation and stabilization. A) Top differentially expressed genes in the Gene Ontology: 0006979 pathway and in a set of oxidative stress associated genes. All genes are statistically significantly differentially expressed and have a value of >ǀ2σǀ based on standard deviation analysis at the 40 min time point. Red indicates upregulation. Blue indicates downregulation. B) Quantification of CellROX reveals significant upregulation of ROS, and associated oxidative stress, at early time points in layered hypoxic conditions compared to nonhypoxic conditions. n = 3 independent experiments per condition. Graphical data are reported as mean ± SD. *p < 0.05. C) Curated IPA pathways at the 40 min time point. All pathways have statistically significant overlap. Ratios indicate the number of genes in our dataset compared to the total number of genes in each pathway. Activation Z‐score indicates activation (+ value) or deactivation (− value). D) Forskolin (cAMP agonist) inhibits cluster formation in hypoxic conditions. Scale bars: 200 µm. E) Top differentially expressed genes in the Matrisome Project gene set ECM regulators. All genes are statistically significantly differentially expressed and have a value of >ǀ2σǀ based on standard deviation analysis at the associated time point. Red indicates upregulation. Blue indicates downregulation. F) ProtInh and EDTA both partially inhibit cluster formation when used in isolation, but result in substantial reduction in cluster formation when used as a combination inhibitor (P + E). Scale bars: 200 µm. G) FPKM of VCAM1 over the experimental time course. H) VCAM1 expression in hypoxic and nonhypoxic conditions at the 24 h time point. I) VCAM expression in forskolin treated hypoxic and nonhypoxic conditions at the 24 h time point. Scale bars (H,I): 20 µm. *p < 0.05, **p < 0.01, ***p < 0.001, ****p < 0.0001.
