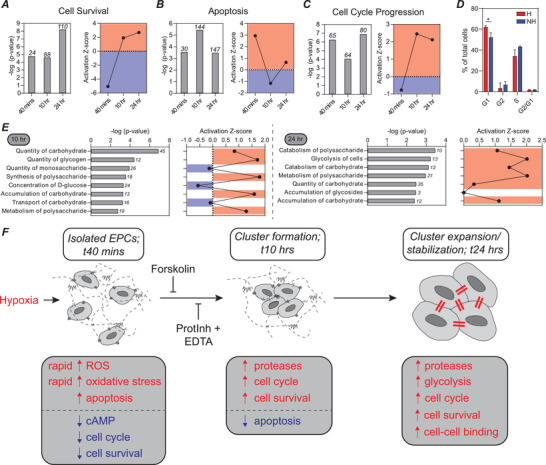
Figure 5.

Cell survival, apoptosis, cell cycle progression, and metabolism are differentially regulated as ECFC clusters form. A) There is a statistically significant overlap in the genes from our dataset and the set of genes regulating cell survival. Bars are the −log (p‐value), with the number of relevant genes listed above each bar. The activation Z‐score predicts that cell survival is downregulated at the 40 min time point and upregulated at 10 and 24 h. B) Statistically significant overlap between genes in our dataset and those associated with apoptosis. This set of genes is initially upregulated (40 min), then downregulated (10 h), and then upregulated again (24 h). C) Statistically significant overlap between genes in our dataset and those associated with cell cycle progression. This set of genes is initially downregulated (40 min), then upregulated at 10 and 24 h. D) Flow cytometry analysis of cell cycle with propidium iodide staining. E) Many biological functions associated with carbohydrate metabolism are significantly upregulated at the 10 and 24 h time points. *p < 0.05, **p < 0.01, ***p < 0.001, ****p < 0.0001. F) Proposed mechanism for cluster formation and stabilization. Hypoxia leads to upregulation of ROS and oxidative stress. In response to ROS, genes encoding antioxidants are upregulated to protect cells from oxidative stress. At early time points, pathways associated with cAMP signaling are downregulated, and a cAMP agonist, forskolin, inhibits cluster formation. Proteases are then upregulated to degrade the matrix and clusters form. Broad spectrum, multitarget protease inhibitors block cluster formation. Increases in cell survival and cell cycle progression, as well as decreases in apoptosis are associated with cluster formation. Upregulation of carbohydrate metabolism and cell–cell interactions occur at later time points.
