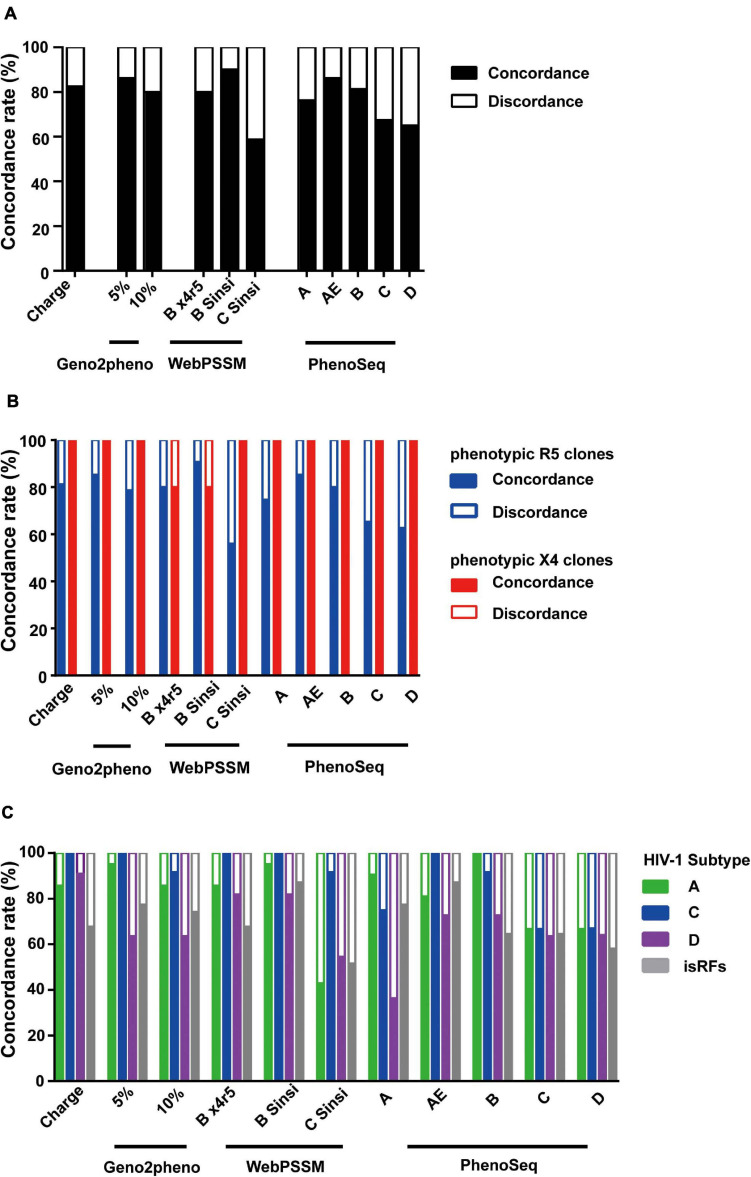
FIGURE 3.
Comparison of phenotypic and genotypic tropism testing. Testing genotypic algorithms of the panel of envelope clones with respect to phenotypic tropism data. The genotypic result was considered concordant when it correctly matched the phenotypic result. (A–C) Concordance rate when all clones were shown (A), when phenotypic R5 and X4 clones were separately shown (B), and when phenotypic R5 clones were shown stratified by the pre-determined subtype information (C).

