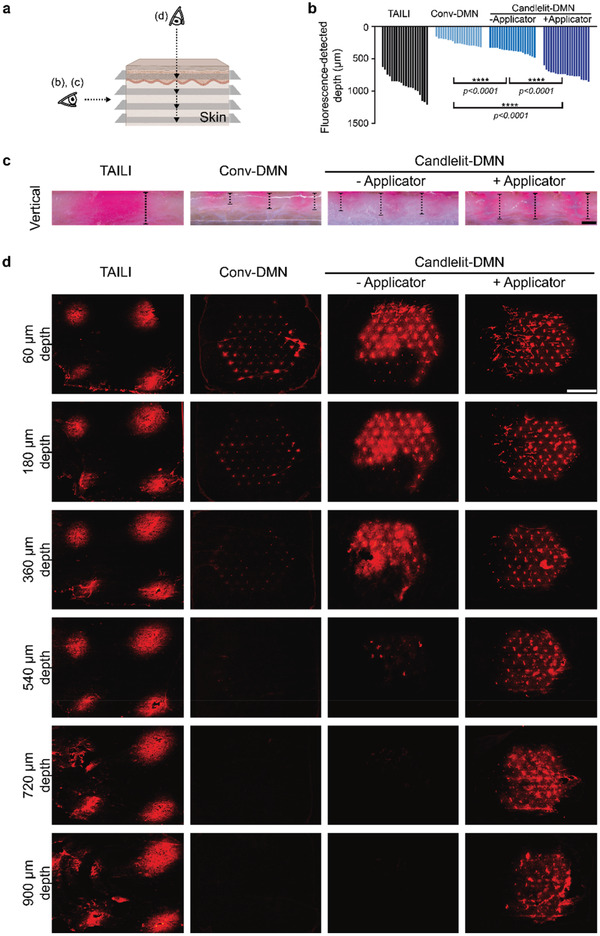
Figure 5.

Drug delivery depth and distribution of TAILI, Conv‐DMN, and Candlelit‐DMN in ex vivo human skin. a) Schematics of viewpoint for images in (b), (c), and (d). b,c) The fluorescence depth is measured in the vertical section view after TAILI or application of Conv‐DMN and Candlelit‐DMN into the ex vivo human skin (n = 20 in each group). ****p < 0.0001; one‐way ANOVA with Tukey's multiple comparisons test. d) Each horizontally sectioned ex vivo human skin after TAILI or application of Conv‐DMN or Candlelit‐DMN was observed under a fluorescence microscope. Black bar: 500 µm, White bar: 5 mm
