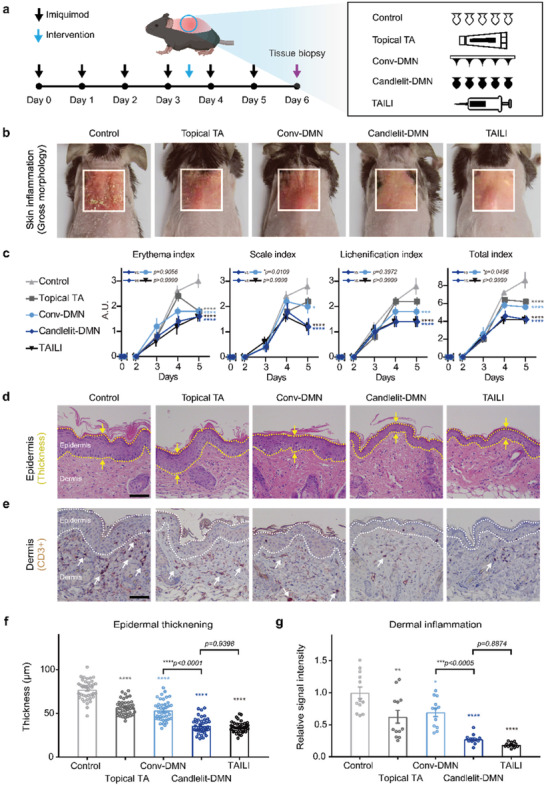
Figure 6.

Anti‐inflammatory pharmacodynamics of Candlelit‐DMN with an applicator in vivo. a) Experiment timeline. b) The representative gross morphology of mice at day 6. c) The skin inflammation severity index (n = 5 in each group). *p = 0.0496, ***p = 0.0002, ****p < 0.0001 compared to the control group for each index on day 6; two‐way ANOVA with Tukey's multiple comparisons test. d) Representative histologic manifestations (H&E staining). Epidermis is in the yellow dotted line. The thickness of the epidermis was measured (yellow arrow). e) Representative immunohistochemical manifestations. Epidermis is in the white dotted line. The immunocytes in the dermis are indicated by white arrows. Black bar: 100 µm. f,g), Epidermal thickening and dermal inflammation of mouse skin tissue (n = 40 and n = 12 spots in each group, respectively). *p = 0.0204, **p = 0.0024, ****p < 0.0001 compared to the control group; one‐way ANOVA with Tukey's multiple comparisons test.
