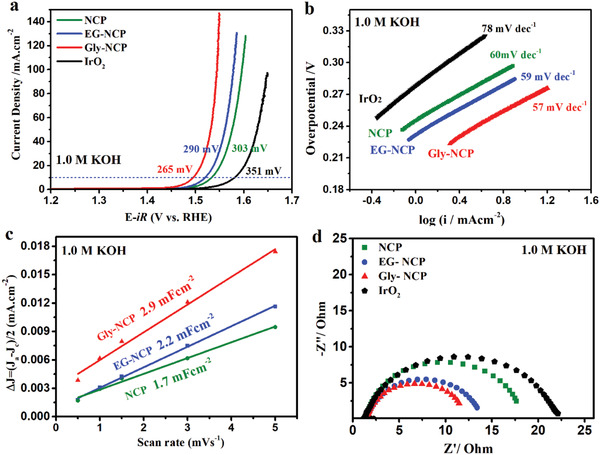
Figure 3.

a) OER polarization curves and b) Tafel plots of NCP, EG‐NCP, Gly‐NCP, and IrO2 catalysts in 1.0 m KOH. c) Capacitive current densities of the different catalysts plotted against the scan rate and corresponding C dl values estimated through linear fitting of the plots. d) Nyquist plots of different catalysts recorded at a given potential of 0.65 V (vs Hg/HgO) with the frequency range of 0.01–100 kHz.
