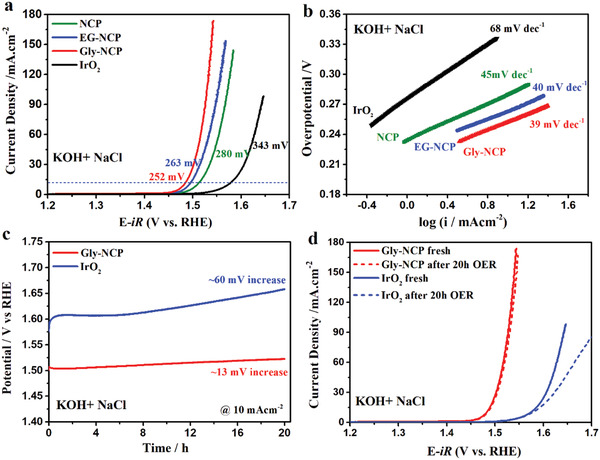
Figure 4.

a) Saline water oxidation polarization curves and b) Tafel plots of different catalysts in alkaline simulated seawater of 1.0 m KOH+0.5 m NaCl. c) 20 h durability tests of Gly‐NCP and IrO2 catalysts at the constant current of 10 mA cm−2. d) Comparison of saline water oxidation activity of Gly‐NCP and IrO2 catalysts before and after durability test in 1.0 m KOH+0.5 m NaCl electrolyte.
