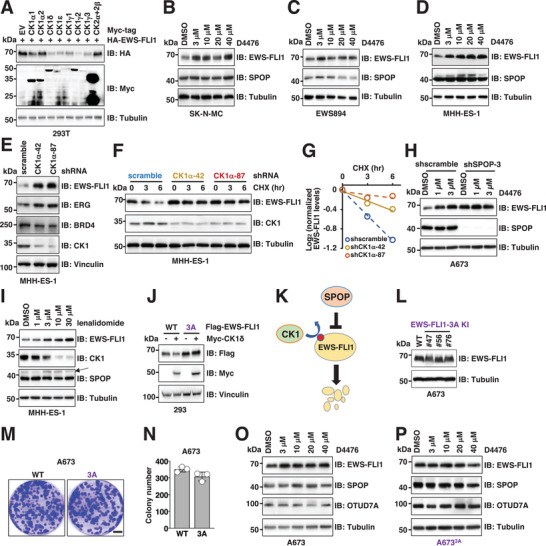
Figure 2.

CK1 phosphorylates and primes EWS–FLI1 for SPOP‐mediated degradation. A) IB analysis of WCL derived from HEK293T cells transfected with indicated DNA constructs. Cells were collected 48 h post‐transfection. B–D) IB analysis of WCL derived from SK‐N‐MC (B), EWS894 (C), and MHH‐ES‐1 (D) cells treated with indicated concentrations of CK1 inhibitor D4476 for 16 h. E) IB analysis of WCL derived from MHH‐ES‐1 cells depleted of endogenous CK1α. Cells were infected with lentiviruses targeting CK1α and selected with 1 µg mL−1 puromycin for 3 days to eliminate non‐infected cells. F,G) IB analysis of WCL derived from indicated MHH‐ES‐1 cells treated with 200 µg mL−1 CHX and harvested at indicated time periods. (G) is a quantification of (F). H) IB analysis of WCL derived from control or endogenous SPOP‐depleted A673 cells treated with indicated concentrations of CK1 inhibitor D4476 for 16 h. I) IB analysis of WCL derived from MHH‐ES‐1 cells treated with indicated concentrations of lenalidomide for 16 h. J) IB analysis of WCL derived from HEK293 cells transfected with 100 ng Flag‐EWS–FLI1‐WT or ‐3A together with 2 µg Myc–CK1δ constructs. K) A cartoon illustration of the proposed model: CK1‐mediated EWS–FLI1 phosphorylation primes EWS–FLI1 for SPOP recognition and degradation. L) IB analysis of WCL derived from parental and three isogenic EWS–FLI1‐S464A/S465A/S466A knock‐in A673 cells. M,N) Representative images for 2D colony formation using cells from (L, #76) and quantified in (N). Error bars were calculated as mean +/− SD, n = 3. *p < 0.05 (one‐way ANOVA test). Scale bar represents 10 mm. O,P) IB analysis of WCL derived from parental or an isogenic EWS–FLI1‐S464A/S465A/S466A knock‐in A673 (L, #76) cells treated with indicated concentrations of CK1 inhibitor D4476 for 16 h.
