Figure 3.

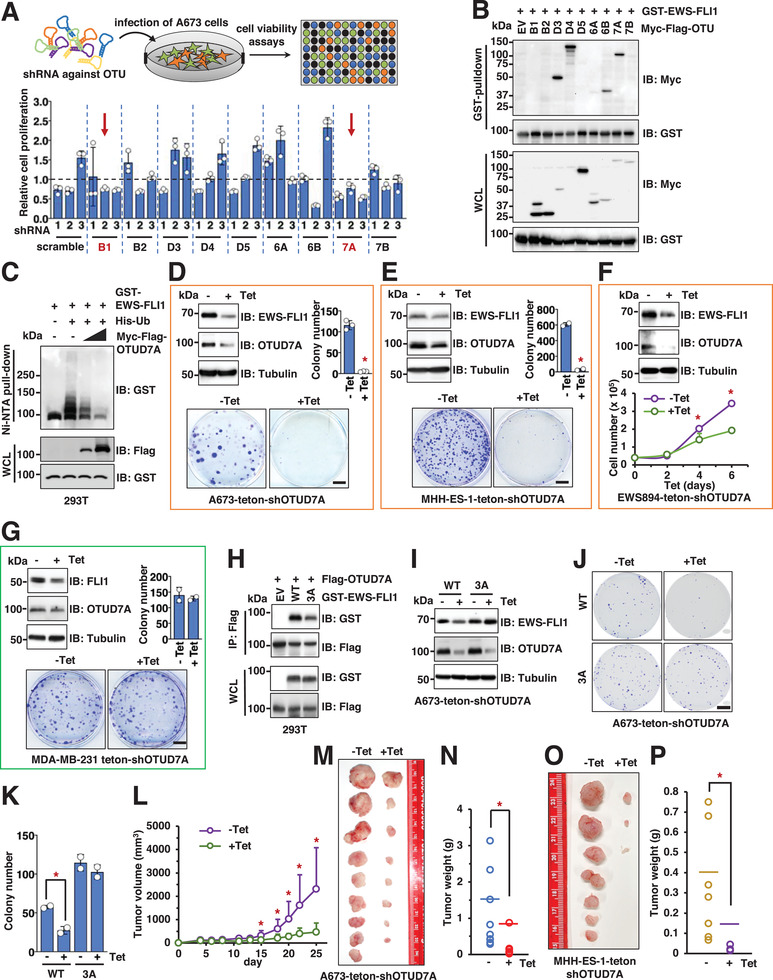
Genetic inactivation of OTUD7A leads to decreased EWS–FLI1 protein abundance and subsequently impeded Ewing sarcoma cell growth in vitro and in mice. A) shRNA‐mediated OTUB1 and OTUD7A depletion attenuates A673 cell viability. Top panel, illustration of the pipeline for shRNA‐guided screen: 3 independent shRNAs targeting each OTU were used to deplete endogenous OTU targets. 3 days postinfection, 1000 cells were plated into 96‐well plates in triplicates and cell viability was monitored 3 days postseeding by MTT assays. Error bars were calculated as mean +/− SD, n = 3. B) IB analysis of GST‐pulldown and WCL derived from HEK293T cells transfected with indicated DNA constructs. C) IB analysis of Ni–NTA pulldown and WCL derived from HEK293T cells transfected with indicated DNA constructs. D–G) Top panels, IB analysis of WCL derived from A673 (D), MHH‐ES‐1 (E), EWS894 (F), or MDA‐MB‐231 (G) cells depleted of endogenous OTUD7A by a tet‐on shRNA against endogenous OTUD7A. 1 µg mL−1 tetracycline was added into cell culture for 72 h before cell collection. Bottom panels, representative colony formation assays (D, E, G) or cell growth assays (F) using cells obtained in the corresponding top panels. Error bars were calculated as mean +/− SD, n = 3 for (D), (F) and n = 2 for (E), (G). *p < 0.05 (one‐way ANOVA test). For (D) and (G), the scale bar represents 5 mm. For (E), the scale bar represents 10 mm. H) IB analysis of Flag‐IPs and WCL derived from HEK293T cells transfected with indicated DNA constructs. I) IB analysis of WCL derived from parental or EWS–FLI1‐3A knock‐in A673 cells expressing teton‐shOTUD7A. Where indicated, 1 µg mL−1 tetracycline was added into cell culture for 72 h before cell collection. J,K) Representative images for 2D colony formation using cells from (I) and quantified in (K). Error bars were calculated as mean +/− SD, n = 2. *p < 0.05 (one‐way ANOVA test). The scale bar represents 10 mm. L–N) Mouse xenograft experiments were performed with indicated A673 cells. 5 days postinjection when tumors were established in mice, either tetracycline dissolved in water with 1% sucrose, or 1% sucrose dissolved in water only, was fed to mice. Tumor volumes were monitored by caliper measurements at indicated days (L). 25 days postinjection, mice were sacrificed, and tumors were dissected (M) and weighed (N). Error bars were calculated as mean +/− SD, n = 9. *p < 0.05 (one‐way ANOVA test). O,P) Mouse xenograft experiments were performed with indicated MHH‐ES‐1 cells. 7 days postinjection when tumors were established in mice, either tetracycline dissolved in water with 1% sucrose, or 1% sucrose dissolved in water only, was fed to mice. 32 days postinjection, mice were sacrificed, and tumors were dissected (O) and weighed (P). Error bars were calculated as mean +/− SD, n = 7. *p < 0.05 (one‐way ANOVA test).
