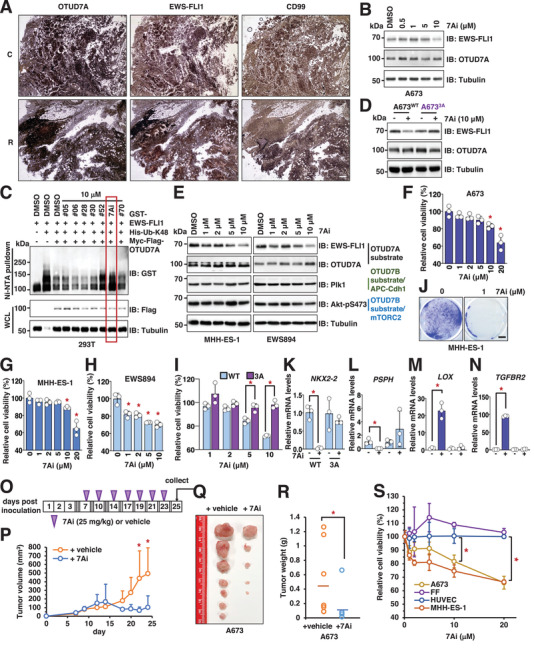
Figure 5.

Identification of 7Ai as a lead compound to inhibit OTUD7A activation to suppress Ewing sarcoma growth. A) Representative IHC images for two Ewing sarcoma tumors obtained from patients stained with indicated antibodies. The scale bar represents 25 µm. C: calvarium; R: rib. B) IB analysis of WCL derived from A673 cells treated with indicated doses of compound 7Ai for 12 h before cell collection. C) IB analysis of Ni–NTA pulldowns and WCL derived from HEK293T cells transfected with indicated DNA constructs. Where indicated, indicated compounds were added to cell culture 10 h prior to cell collection. D) IB analysis of WCL derived from indicated A673 cells treated with 10 × 10−6 m compound 7Ai for 12 h before cell collection. E) IB analysis of WCL derived from MHH‐ES‐1 or EWS894 cells treated with indicated doses of compound 7Ai for 12 h before cell collection. F–H) Representative cell viability assays using A673 (F), MHH‐ES‐1 (G), and EWS894 (H) cells treated with indicated doses of compound 7Ai for 72 h before measurements. Error bars were calculated as mean +/− SD, n = 3. *p < 0.05 (one‐way ANOVA test). I) Representative cell viability assays using A673WT or A673 3A cells treated with indicated doses of compound 7Ai for 72 h before measurements. Error bars were calculated as mean +/− SD, n = 3. *p < 0.05 (one‐way ANOVA test). J) Representative images for 2D colony formation by MHH‐ES‐1 cells treated with indicated doses of compound 7Ai for 14 days. The scale bar represents 10 mm. K–N) RT‐PCR analyses of mRNA level changes of characterized EWS–FLI1 downstream target genes in both WT and EWS–FLI1‐3A knock‐in A673 cells treated with 1 µg mL−1 Tet for 3 days including NKX2‐2 (K), PSPH (L), LOX (M), and TGFBR2 (N). Error bars were calculated as mean +/− SD, n = 3. *p < 0.05 (one‐way ANOVA test). O) An illustration of the timeline for 7Ai administration into mice. At indicated periods, 25 mg kg−1 7Ai was supplied through IP injection into each mouse. P–R) Mouse xenograft experiments were performed with A673 cells treated with vehicle or 7Ai. 7 days postinjection when tumors were established in mice, 7Ai (25 mg kg−1) was injected through IP route to mice. Tumor volumes were monitored by caliper measurements at indicated days (P). 25 days postinjection, mice were sacrificed and tumors were dissected (Q) and weighed (R). Error bars were calculated as mean +/− SD, n = 7. *p < 0.05 (one‐way ANOVA test). S) Representative cell viability assays using two Ewing sarcoma cells (A673 and MHH‐ES‐1) and two normal control cells (HUVEC and foreskin fibroblast (FF)) treated with indicated doses of compound 7Ai for 72 h before measurements. Error bars were calculated as mean +/− SD, n = 3. *p < 0.05 (one‐way ANOVA test).
