Figure 1.

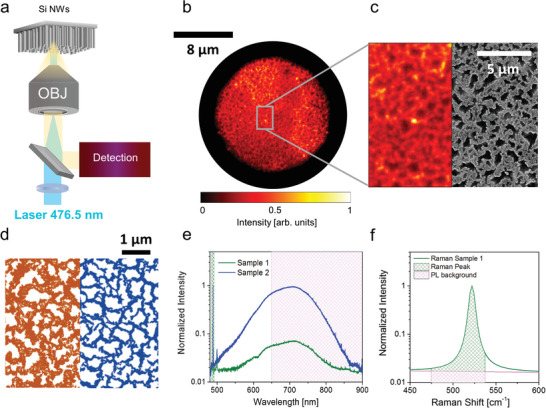
Structural and optical characterization of fractal silicon nanowire arrays. a) Schematics depicting the illumination of the nanowire samples with a laser line at 476.5 nm focused onto the back focal plane of a microscope objective to generate a near‐plane wave at the sample side (100x, N.A. = 0.9). The optical signal from the sample is collected via the same objective and redirected toward the detection system comprising a branch for real‐space imaging, one for spectroscopy and one for angular detection (Section S2 and Figure S2, Supporting Information). b) A typical bright‐field optical microscopy image from a sample of Si nanowires in a random fractal arrangement with 60 ± 2% filling factor (FF) for Sample 1. In order to improve the contrast, the image has been acquired with a reduced field of view as obtained by reducing the aperture of the condenser diaphragm in a Köhler configuration. The background‐subtracted image is normalized to its maximum intensity. c) Comparison between an enlarged detail from b) and a scanning electron micrograph (at low magnification) of the same sample. The two images are reproduced with the same scalebar for direct comparison. d) Scanning electron micrographs of Sample 1 (left) and Sample 2 (right) highlighting the different surface coverages. e) Spectra reporting the sharp Raman signal and the broad photoluminescence (PL) band from both Si nanowire samples (Sample 1 and Sample 2 with stronger photoluminescence). Spectra are normalized to the intensity of the first order Raman peak. The filled areas correspond to the spectral regions used for integrating the Raman (green) and photoluminescence signals (magenta), respectively. In particular, the photoluminescence was integrated in the 650–900 nm range due to the combination of filters used to eliminate the lines corresponding to the residual laser and the Raman contribution (Experimental Section). f) Detail of the Si nanowire 1st order Raman peak, showing the contribution of the integrated Raman signal (green) and photoluminescence background (magenta) based on the employed filters (Experimental Section), respectively. Note that, when excited at 476.5 nm, the photoluminescence background is very low with a negligible integrated intensity (<2%) compared to the integrated intensity of the Raman signal for both samples. Filling factors are expressed as mean ± standard deviation (SD) after averaging over 5 different scanning electron microscopy (SEM) micrographs per sample.
