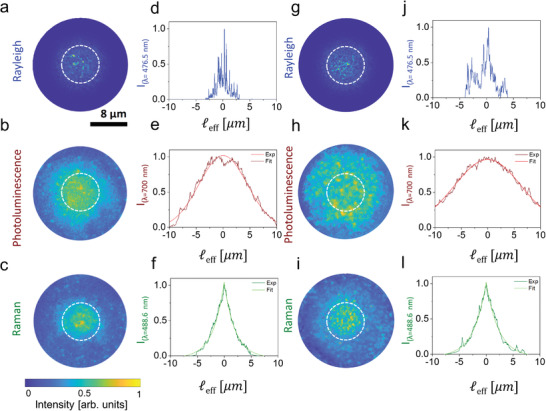
Figure 2.

Real‐space optical microscopy of Rayleigh, photoluminescence, and Raman light propagation in the nanowires. a–c) Optical images for the a) Rayleigh, b) photoluminescence, and c) Raman signals and d–f) their relative intensity profiles from Sample 1. g–i) Corresponding optical images and j–l) intensity profiles from Sample 2. The Rayleigh signal has been acquired at 476.5 nm, the photoluminescence in the 650–‐900 nm spectral region, and the Raman signal in the narrow 487–489 nm spectral region. The white dashed circles correspond to the 8 µm area of the sample directly illuminated by the collimated laser beam used for excitation (FWHM ≈8 µm). The reported background‐subtracted optical images a–c,g–i) are normalized to their common maximum of intensity. The intensity profiles for d,j) the Rayleigh signal along a diameter of a,g), e,k) the photoluminescence and f,l) the Raman signals are shown as a function of the effective length ℓeff = ℓ/n eff, where ℓ is the distance from the center of the beam scaled for the refractive index of the light in the effective medium n eff (Table 1). The photoluminescence and Raman profiles are obtained averaging four intensity profiles per image along the angular coordinate (see the Experimental Section) over five different images and are normalized to their maximum values. These profiles are then fitted with the characteristic e,k) diffusive Gaussian and f,l) localization exponential functions, respectively.
