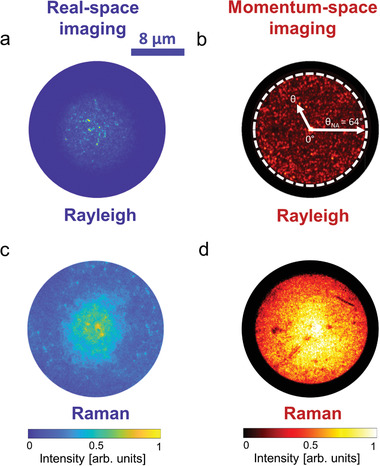
Figure 3.

Fourier microscopy and coherent backscattering visualization. Images of a,b) Rayleigh scattering and c,d) Raman scattering in a,c) real space and b,d) Fourier (momentum space) for Sample 1. The white dashed circle in b) highlights the angle corresponding to the numerical aperture (64°) limiting collection through the 100x objective (NA = 0.9) in our setup as depicted from the arrow θNA. The positive angle θ represents the angular cone of acceptance between 0° and θNA = 64° (i.e., the angle defined by the numerical aperture of the objective). All images have been acquired by exciting the Si nanowires with the 476.5 nm laser line in the helicity conserving polarization (HCC) channel (see the Experimental Section). Both Fourier and real space background‐subtracted images are normalized to the respective common maximum of intensity.
