Figure 4.

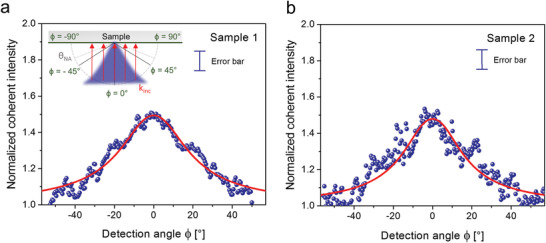
Raman coherent backscattering cone. a,b) Experimental Raman coherent backscattering cones (dots) and fitting curves (solid red lines) for a) Sample 1 and b) Sample 2. The experimental cones were obtained from the ratio between the HCC intensities to the respective incoherent background acquired in the cross‐polarization (Vertical‐Horizontal (VH)) channel (see Section S4, Supporting Information), after normalizing them in order to overlap their values at large angles (at 55°). The sketch in the inset represents both the incident plane‐wave (red arrows) impinging on each sample point with the same k‐vector at normal incidence, and the backscattered Raman light directed toward the incident radiation (blue cone). The planar detection angle ϕ is also defined. This angular coordinate is defined with respect to the normal to the sample and is the angular coordinate at which the measurement of the Raman backscattering cone is taken. It varies over 180° (from −90° to 90°), where ϕ = 0° coincides with detecting along the normal to the sample surface. The NA of the objective allows for a detection at an angle varying from −64° to 64°. Error bars on the data points are included in the legend to the graphs and represent the experimental uncertainty of the normalized scattered intensity, taking into account the reliability of both the HCC and VH polarization configurations (see the Experimental Section).
