Figure 5.

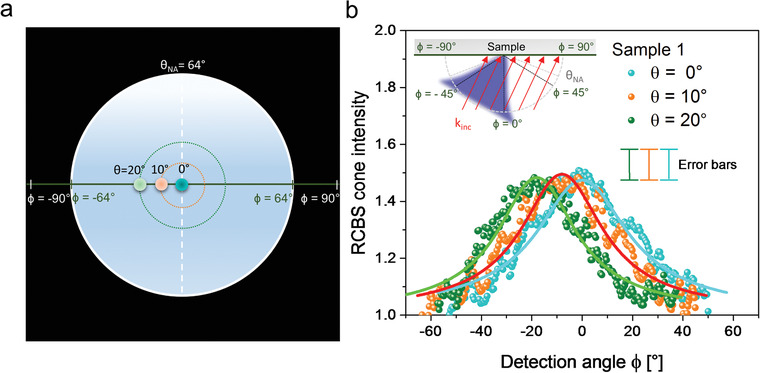
Directional emission of the Raman coherent backscattering cone. a) Scheme depicting the focusing of the laser beam at different points of the back‐focal plane of the objective. These entrance points are defined within different positive incident angles θ within the angular cone of acceptance of the objective, i.e., between 0° and θNA = 64° (i.e., the angle defined by the numerical aperture of the objective): θ = 0° (blue dot), θ = 10° (orange dot), and θ = 20° (green dot). The detection angle ϕ is defined as in Figure 4. b) Normalized Raman coherent backscattering cones (dots) and fitting curves (solid lines) from Sample 1 obtained at the three laser incidences defined in a). Note that, in this case, the exact backscattering angles ψ = 0° coincide each time with the detection angle ϕ = 0°, ϕ = −10°, and ϕ = −20°. The sketch in the inset represents both the incident plane‐wave (red arrows) impinging each sample point with the same k‐vector, and the backscattered Raman light directed toward the incident radiation (blue cone). Error bars on the data points are included in the legend to the graphs and represent the experimental uncertainty of the normalized scattered intensity, taking into account the reliability of both the HCC and VH polarization configurations (see the Experimental Section for details).
