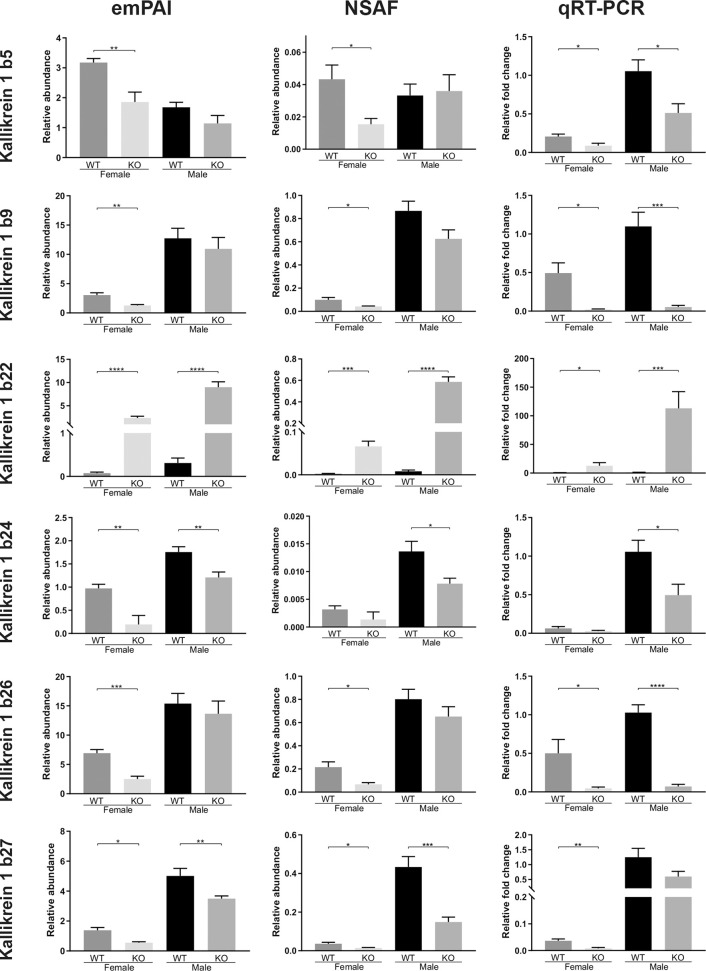
Figure 4.
Quantitative comparisons of various Kallikrein 1-related proteases in the murine submandibular salivary gland tissue, at the protein level (NSAF and emPAI mass spec quantifications of relative abundances) and at the transcription level (qRT-PCR comparative fold change amounts). All animals in the proteomic analysis (n = 6) were also subsequently analyzed with qRT-PCR. Data are presented as mean values ± SEM. Statistically significant differences according to t-test between FWT vs FKO or MWT vs MKO groups are indicated as *p < 0.05, **p < 0.01, ***p < 0.001 and ****p < 0.0001.

