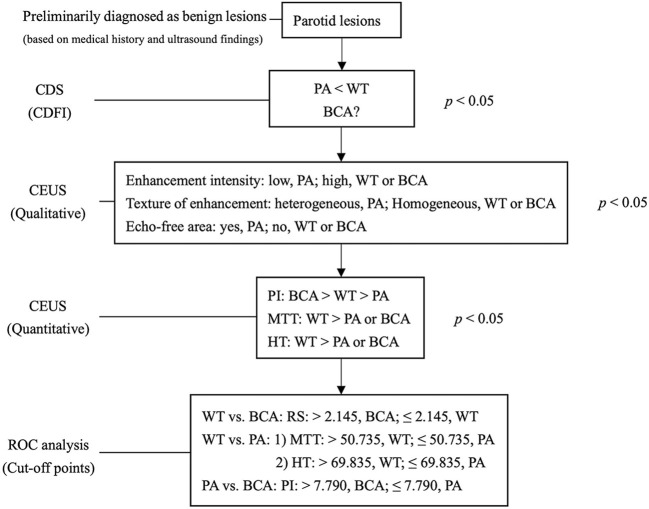
Figure 1.
Multimodal diagnostic pathway. The salivary lesions were preliminarily diagnosed as benign lesions based on medical history and B-mode ultrasound. The grade of CDFI distinguishes hyper- from hypo-vascularised tumor entities initially. Qualitative analysis of CEUS showed specific features of lesions in the PA group and quantitative analysis of CEUS further differentiated the lesions in the BCA and WT groups. PA, pleomorphic adenoma; WT, Warthin tumor; BCA, basal cell adenoma; CEUS, contrast-enhanced ultrasound; CDFI, Color Doppler flow imaging; PI, peak intensity; MTT, mean transit time; HT, time from peak to one half; RS, rising slope of wash in curve; P < 0.050 was considered to be statistically significant. The optimal cutoff points calculated by ROC curve analysis are for diagnostic reference only.

