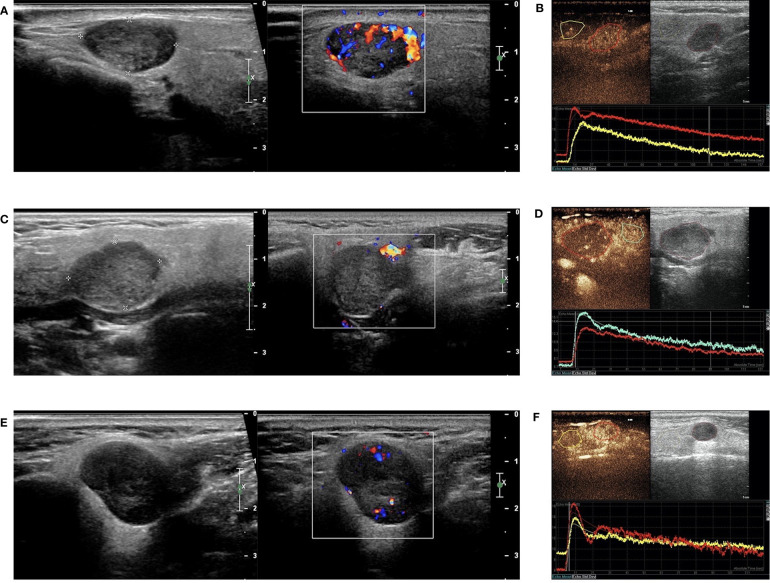
Figure 5.
B-mode sonography, Color Doppler sonography (CDs), and dual-imaging of CEUS and gray-scale US with ROI in the remarkable perfusion areas in both the lesions and the surrounding tissues. (A) Hypoechoic and regular masses with well-defined border in the parotid glands of patients with WT, and CDs displayed marked intratumal vascularity in the lesion (grade III); (B) TIC analysis by the QLAB software showed that the red line represented the lesion of WT, while the yellow line represented the surrounding tissues; (C) Hypoechoic and regular masses with a well-defined border in the parotid glands of patients with PA and CDs showing no blood flow signal in the lesion (grade 0); (D) TIC analysis by the QLAB software showing that the red line represented the lesion of PA, while the green line represented the surrounding tissues; (E) hypoechoic and regular masses with a well-defined border in the parotid glands of patients with BCA and CDs showing a small amount of blood flow in the lesion (grade II); (F) TIC analysis by the QLAB software showing that the red line represented the lesion of BCA, while the yellow line represents the surrounding tissues. ROI, region of interest; TIC, time-intensity curve.

