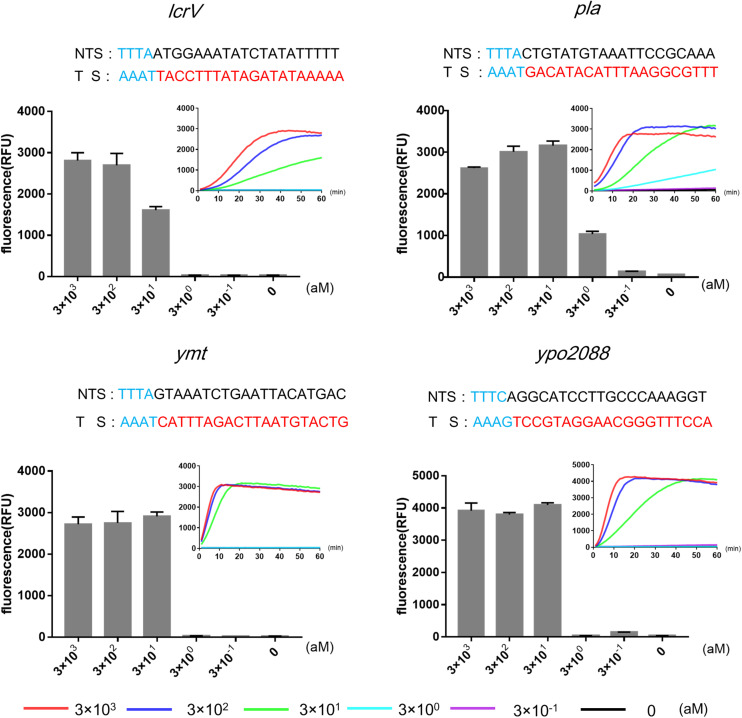
FIGURE 2.
Limits of detections (LODs) of RPA-Cas12a detection of four target genes of Yersinia pestis using different concentrations of genomic DNA (3 × 10− 1 to 3 × 10³ aM). Real-time curves show fluorescence signals taken every minute within 1 h. Bar graphs show the endpoint fluorescence intensities detected at 1 h of detection. Data are represented as mean with standard deviation (SD) (n = 3). LODs, limits of detection; RPA, recombinase polymerase amplification.

