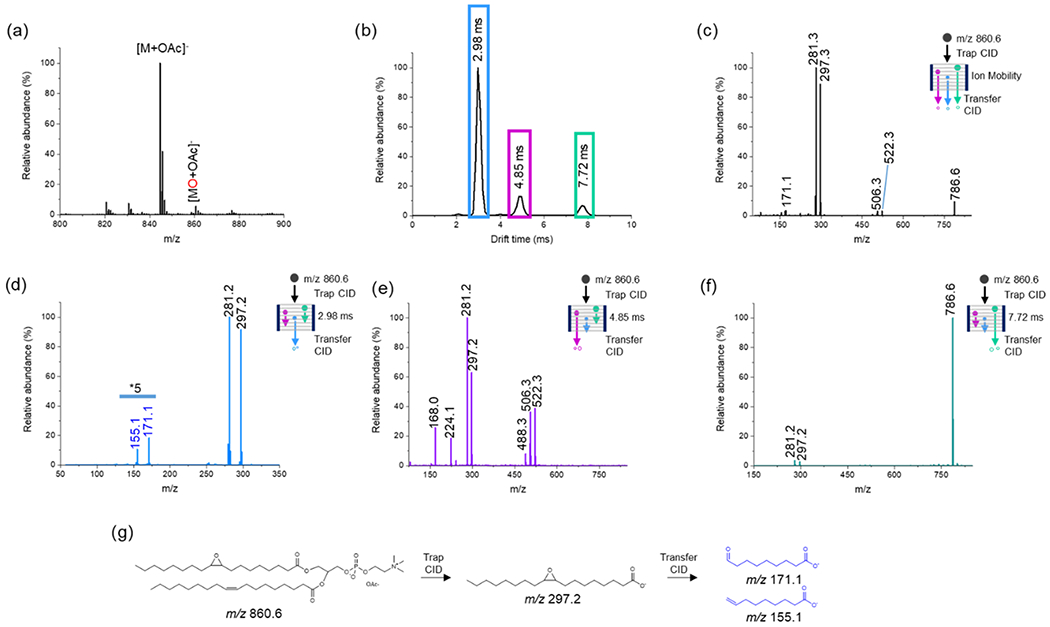
Figure 2.

Negative-ion mode analysis of 20 μM PC(18:1(9Z)/18:1(9Z)) in acetone/water/methanol (75:12.5:12.5) with 25 mM NH4OAC added. (a) TENG-MS analysis showing the [M + OAc]− epoxidation product. (b) IM total ion ATD following selection of the [MO + OAc]− ion (m/z 860.6) in the quadrupole analyzer and trap CID. The blue, purple, and green boxes depict the various individual (or groups) of product ions produced by trap CID; their TAP product ion spectra are shown in (d–f). (c) Averaged TAP mass spectrum for the full arrival time distribution (ATD) shown in (b). (d) TAP transfer CID spectrum of the group of fragment ions outlined with a blue box in (b). The fragment ions at m/z 171.1 and 155.1 originating from m/z 297.2 indicate the Δ9 double-bond position. (e) TAP transfer CID spectrum of the group of fragment ions outlined with the purple box in (b). The fragment ion at m/z 522.3 corresponds to the loss of the sn1 or sn2 acyl chain as a ketene (RCH═C═O) and loss of CH3 from the head group with the remaining acyl chain oxidized. The fragment ion at m/z 506.3 corresponds to the loss of the sn1 or sn2 acyl chain as a ketene (RCH═C═O) and loss of CH3 from the head group with the remaining acyl chain unoxidized. The fragment ion at m/z 488.3 corresponds to the neutral loss of an RCOOH from sn1 or sn2 with concurrent loss of CH3. (f) TAP transfer CID spectrum of the fragment ion at 7.72 ms fragment with m/z 786.6, [MO + OAc-74]− (green box). The m/z 281.2 and 297.2 fragment ions correspond to the unoxidized and oxidized fatty acyl chains. (g) Fragmentation pathway for the formation of the diagnostic fragments at m/z 171.1 and 155.1.
