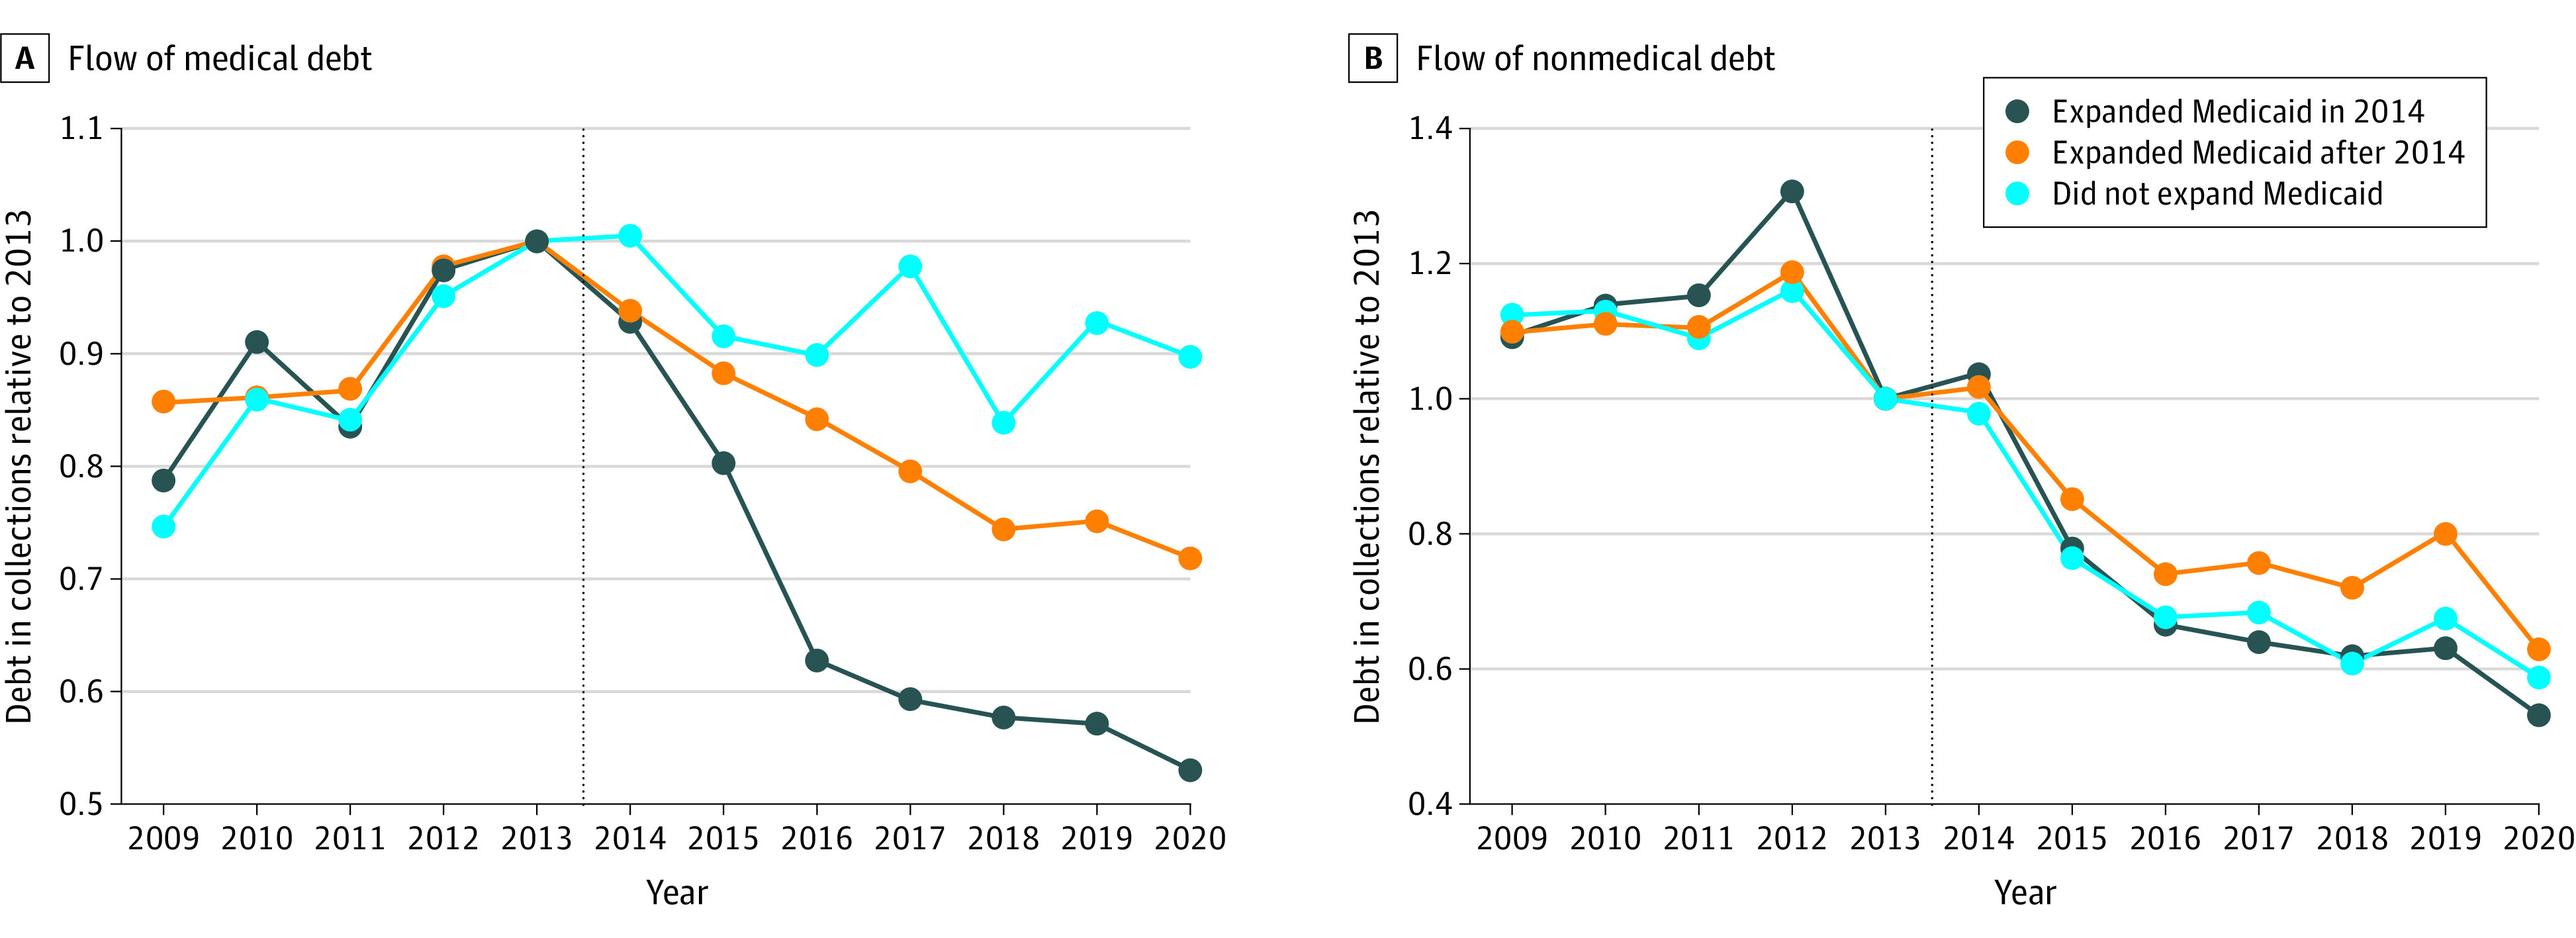
Figure 3. Trends in Medical and Nonmedical Debt in Collections by Medicaid Expansion Status.

The plots show the flow of mean medical and nonmedical debt in collections, grouping states by Medicaid expansion status and normalizing values for each group to 1 in 2013 (eg, the normalized value for 2020 is calculated as the ratio of the unnormalized 2020 and 2013 values for that group). Values are from June of each year. The vertical line indicates the timing of initial Medicaid expansion.
