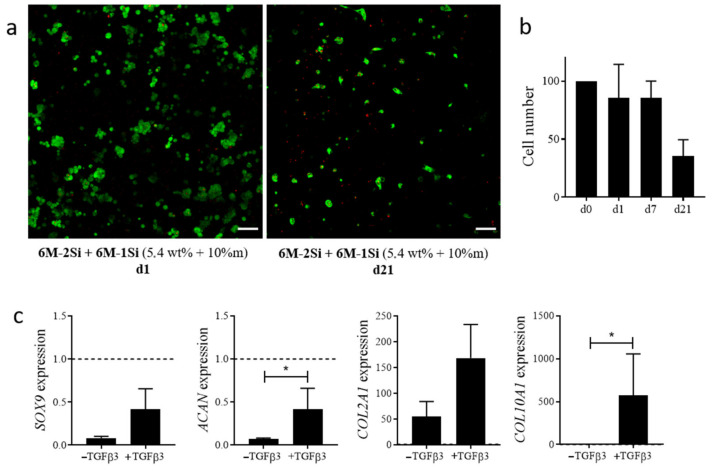
Figure 9.
(a) Cell viability of hMSCs measured by the LIVE/DEAD assay in 6M-2Si/6M-1Si hydrogels after 1 and 21 days of encapsulation. Images are the maximum intensity z-projection. Scale bar is 100 μm. (b) Number of hMSCs measured by DNA quantification in a 6M-2Si/6M-1Si hydrogel at day 0, 1, 7 and 21 days after encapsulation. Data are expressed as the mean ± SEM of four independent experiments and normalized to 100% at day 0. (c) Chondrocyte gene expression in hMSCs encapsulated in 6M-2Si/6M-1Si hydrogels after 21 days of differentiation. Data are expressed as the mean ± SEM of three independent experiments and expressed in a fold change compared with undifferentiated hMSCs at day 0 (dotted line). Statistical analyses were performed using GraphPad prism 9 software with the non-parametric Mann-Whitney test to compare the two conditions. Values are statistically different when p < 0.05 (* p < 0.05).

