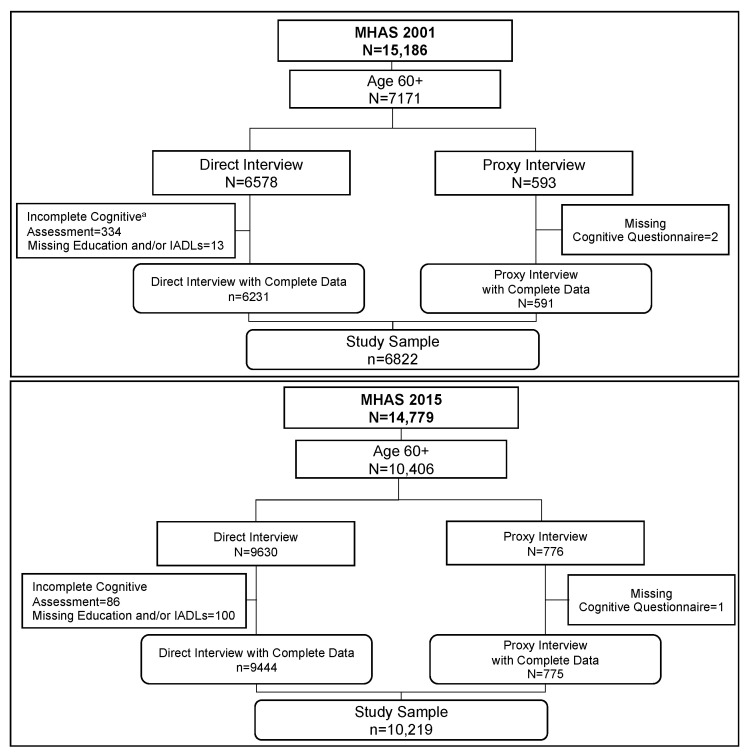
Figure 1.
Flowchart of the Sample Selection for the 2001 and 2015 Cohorts. Note: Flowchart of sample selection in 2001 (n = 6822) and 2015 (n = 10,219). a More cognitive assessments were incomplete in 2001 compared to 2015 because more of the 2001 participants refused to participate in the cognitive assessment because they spoke only the Indigenous language. In 2015, these cases were no longer pursued.

