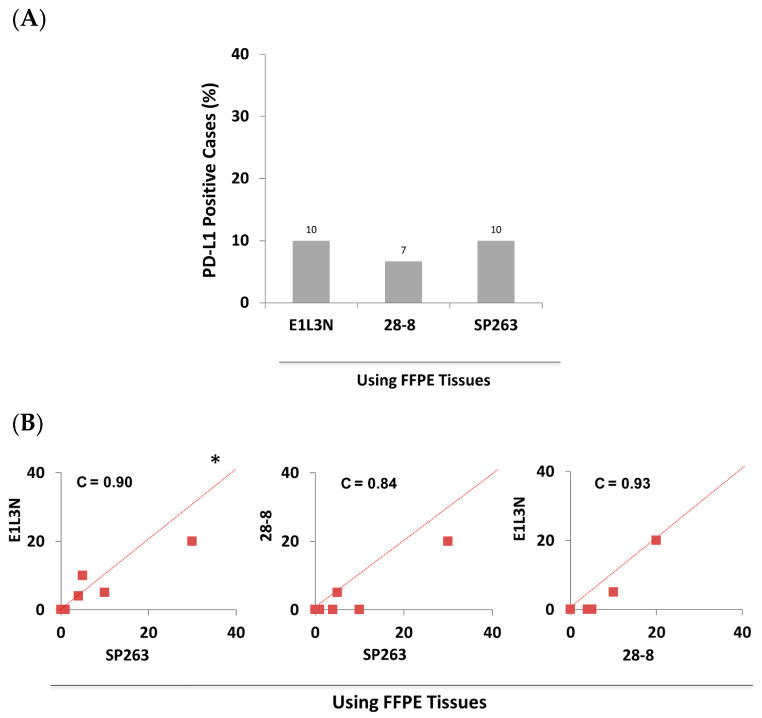
Figure 3.
Comparable PD-L1 IHC detection in FFPE tissues of the subcohort (30 breast cancer patients) using SP263, E1L3N, and 28-8 antibodies. (A) Bar graph showing the prevalence (rate) of positive breast cancer patients (%) in FFPE tissues using three different antibodies. (B) Pairwise comparison of the actual PD-L1 score (TPS) between the three antibodies in FFPE tissues. C = concordance correlation coefficient. * The dashed line represents the 45-degree hypothetical perfect-match line.

