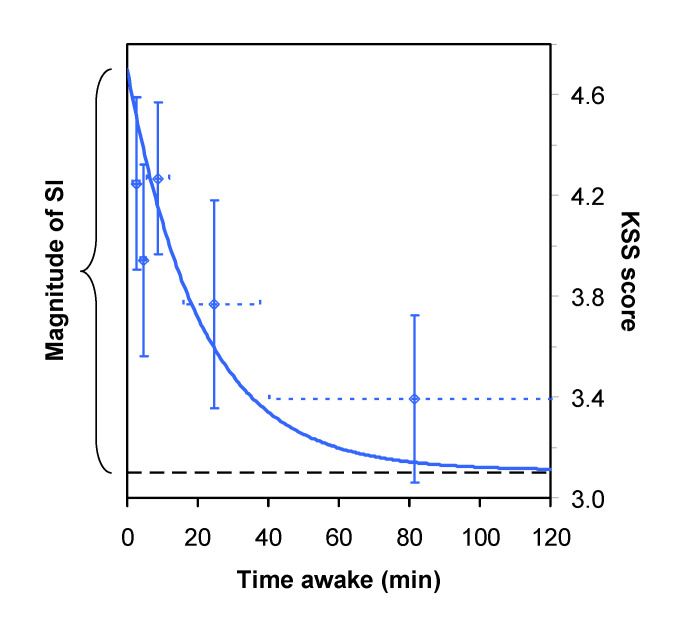
Figure 3.
Nonlinear mixed-effects regression model for the KSS-1 administered immediately after scheduled awakening, as a function of time awake since polysomnographically assessed final awakening. The curve displays the group model for sleepiness (KSS score) from SI after baseline sleep in the first of the three laboratory sessions, in the PSE condition, assuming awakening from stage 1 sleep. The data points represent means of the overall set of observations for the KSS-1 administered immediately after scheduled awakening from baseline sleep, corrected for the model-estimated effects of laboratory session, prior sleep restriction, order effects, sleep stage upon awakening, and systematic interindividual differences in the magnitude of SI and baseline sleepiness—in groups of 10 observations (11 for the right-most data point) ordered by time awake. Vertical error bars indicate standard error of the mean; horizontal error bars indicate the time awake range for the observations captured in the mean. The horizontal dashed line denotes the baseline level of sleepiness to which the SI effect decays over time awake. The magnitude of the SI effect is defined as the maximum level of sleepiness immediately after polysomnographically assessed final awakening relative to the baseline level of sleepiness, as indicated by the curly bracket.

