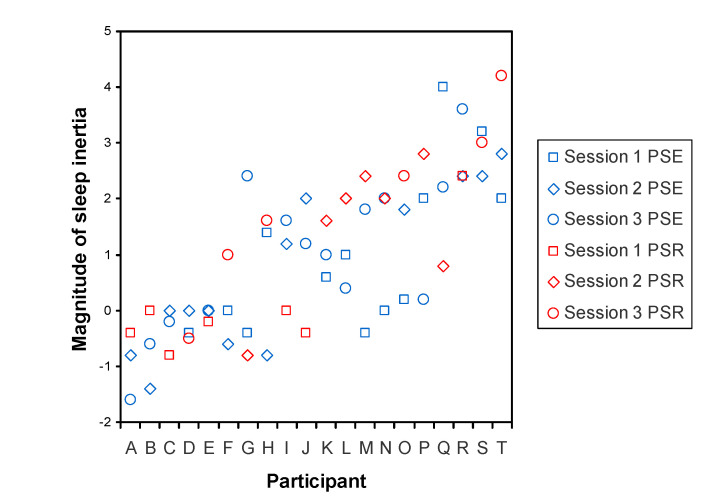
Figure 6.
Systematic interindividual differences in the effect of SI on sleepiness following the baseline sleep period, illustrated by individual participants. Each participant underwent three separate laboratory sessions, the data of which are differentiated by different symbols. Randomized over the participants, one of the three laboratory sessions involved a PSR condition with a 6-h baseline sleep opportunity, whereas the other two laboratory sessions involved a PSE condition with a 12-h baseline sleep opportunity; these are differentiated by color. For this figure, the magnitude of the SI effect was determined as the sleepiness score on the KSS-1 in the test bout immediately after scheduled awakening, expressed relative to baseline sleepiness calculated as the mean of the sleepiness scores on the KSS-1 in the subsequent test bouts from 12:00 up to (but not including) 22:00 (see Figure 1). The abscissa shows the 20 individual participants, labeled A through T, ordered by their average magnitude of the SI effect, such that the least SI-susceptible individuals are on the left and the most SI-susceptible individuals are on the right. The figure shows that individuals differed substantially in the magnitude of the effect of SI on sleepiness, while the effect was relatively consistent within individuals, reflecting stable interindividual differences in the magnitude of SI.

