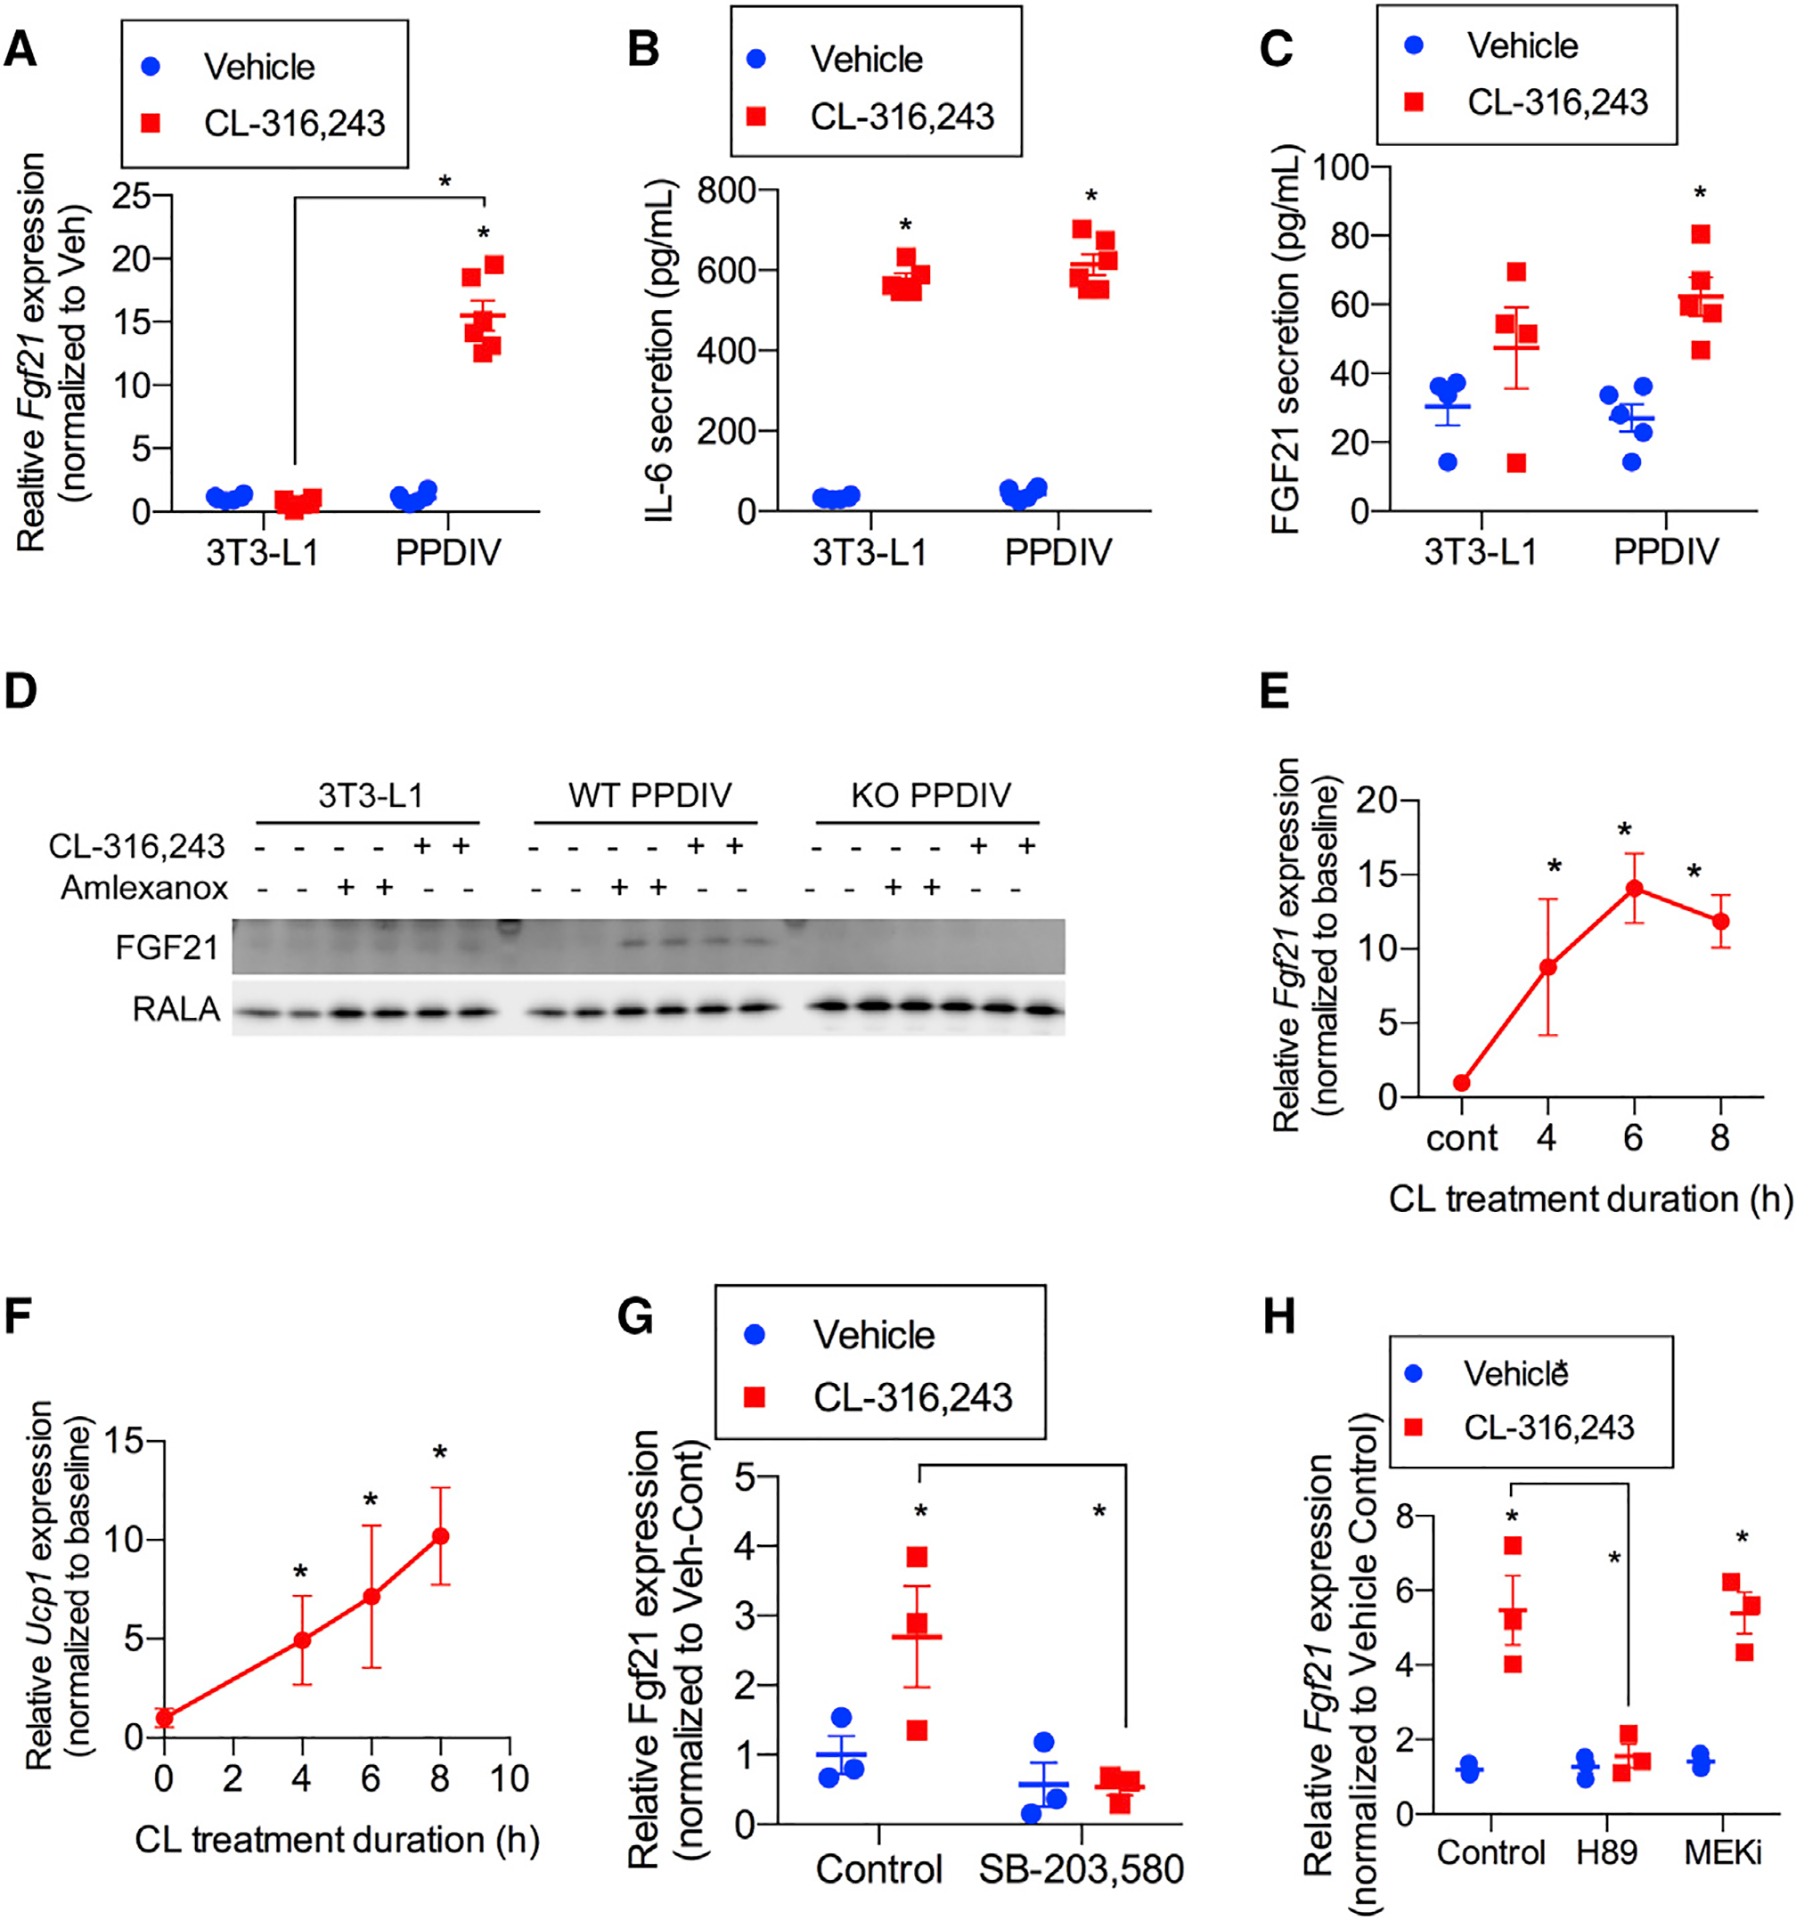
Figure 1. Fgf21 mRNA expression and secretion are induced in PPDIVs following CL-316,243.

(A) Fgf21 mRNA expression in 3T3-L1 adipocyte and PPDIVS following 10 μM CL-316,243 treatment for 6 h. n = 4–6 wells per cell type per treatment.
(B and C) IL-6 (B) and FGF21 (C) secretion following treatment with CL-316,243 as in (A). n = 4–6 wells per cell type per treatment.
(D) Western blot analysis of FGF21 protein levels in 3T3-L1, PPDIVs isolated from WT mice, and PPDIVs isolated from whole-body FGF21-KO. n = 2 wells per genotype/cell type per treatment.
(E and F) Fgf21 (E) and Ucp1 (F) mRNA time course expression in WT PPDIVs following 10 μM CL-316,243 treatment. n = 3 wells per time point.
(G and H) Fgf21 mRNA expression in cells pretreated with 10 μM SB-303,580 (p38 inhibitor) (n = 3 wells per treatment) (G) and 50 μM H89 (PKA inhibitor) or 10 μM MEK inhibitor (PD0325901) (H) for 30 min before 10 μM CL-316,243. n = 3 wells per genotype per treatment. Data presented as mean ± SEM.
(A–C, G, and H) *p < 0.05 from Holm-Sidak post hoc analysis after significant two-way ANOVA for vehicle versus CL-316,243 unless otherwise indicated with a line.
(E and F) *p < 0.01 from t test versus baseline.
