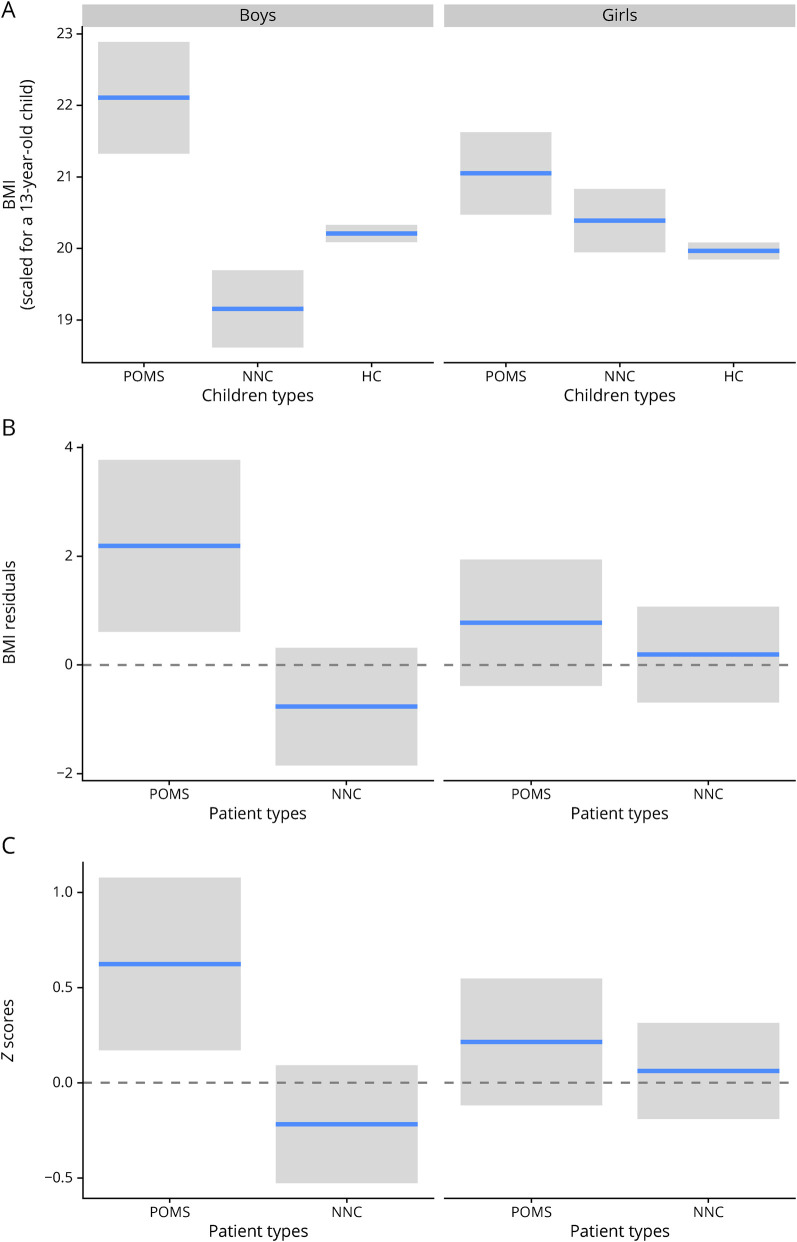
Figure 2. Effects of Sex and Children Type on BMI.
This figure presents on the panel A the BMI predicted by the gam model for each combination of sex and children type. To control for the effect of patients' age, we present the predictions (horizontal blue lines) and their 95% CIs for a 13-year-old child. The panel B represents the BMI in terms of difference between the patient's BMI and the expected BMI of a HC (rBMI). The mean z-scores, which correspond to the rBMI divided by the SD of the BMI of HC, are presented on panel C. BMI = body mass index; HC = healthy control; NNC = non-neurologic control; POMS = pediatric-onset multiple sclerosis; rBMI = residual BMI.

