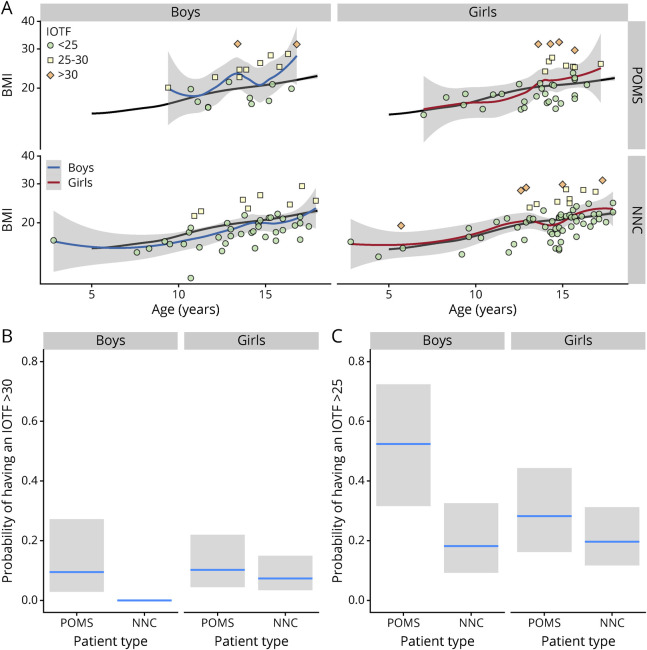
Figure 3. IOTF Categories and Patient Types.
The panel A represents the BMI as a function of age for the patients with POMS (upper line) and NNCs (lower line) for the 2 sexes (boys on the left and girts on the right). The IOTF categories are represented with a color code. The black line is the mean BMI age trajectory computed for the healthy controls. The blue and red lines are the smoothed function adjusted for the 4 categories of and patient types corresponding to the 4 subpanels. Estimation of the proportion of patients having an IOTF larger than 30 (panel B, obese patients) or larger than 25 (panel C, overweight or obese patients) for each combination of sex and patient type (patient with POMS vs NNC). BMI = body mass index; IOTF = International Obesity Task Force; NNC = non-neurologic control; POMS = pediatric-onset multiple sclerosis.

