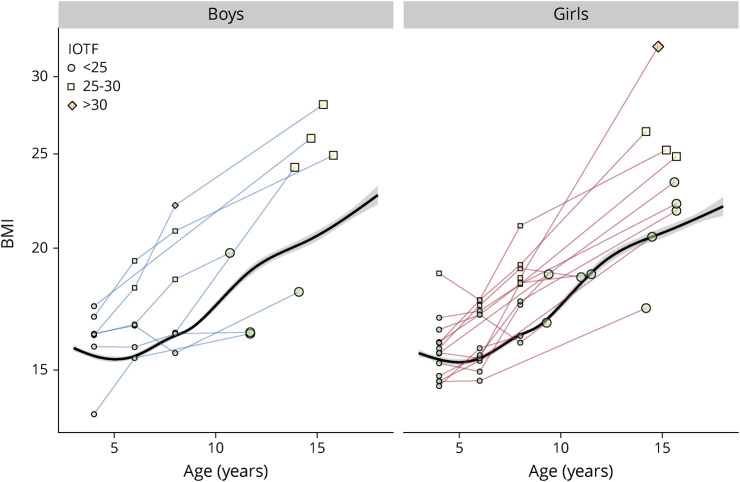
Figure 4. BMI Age-Trajectories.
There are plotter for several young boys and girls before being diagnosed for MS. The last measurement (larger plot) has been performed at the occasion of their first hospitalization for MS. The black smooth line is the mean BMI age trajectory of the healthy controls. BMI = body mass index; IOTF = International Obesity Task Force; MS = multiple sclerosis.

