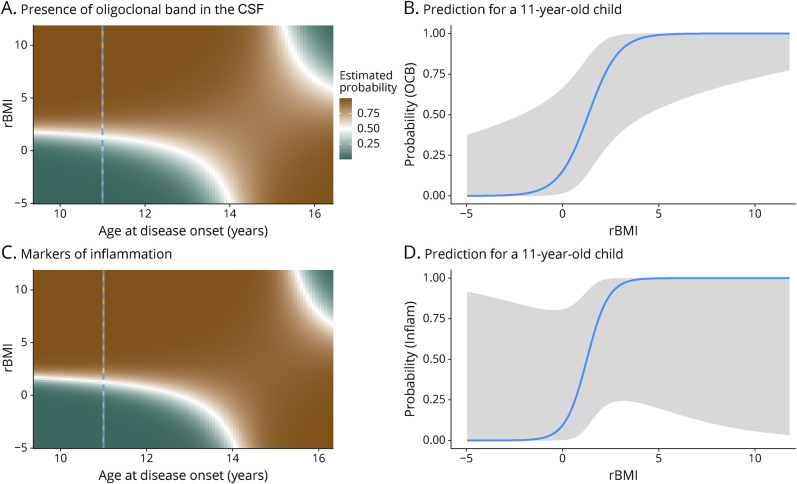
Figure 5. Presence of OCBs and Inflammation in the CSF.
The 2-dimensional density plots (A and C) represent the prediction from the models age × rBMI interaction. The probability to observe an OCB (A) or any other marker of inflammation (pleocytosis and/or hyperproteinorachia and/or OCBs) (C) increases with the patient's corpulence in a prepubertal child (aged <14 years) but not in older patients. The panels B and D represent the model prediction for an 11-year-old patient (underlined with the dotted blues lines in panels A and C). OCB = oligoclonal band; rBMI = residual body mass index.

