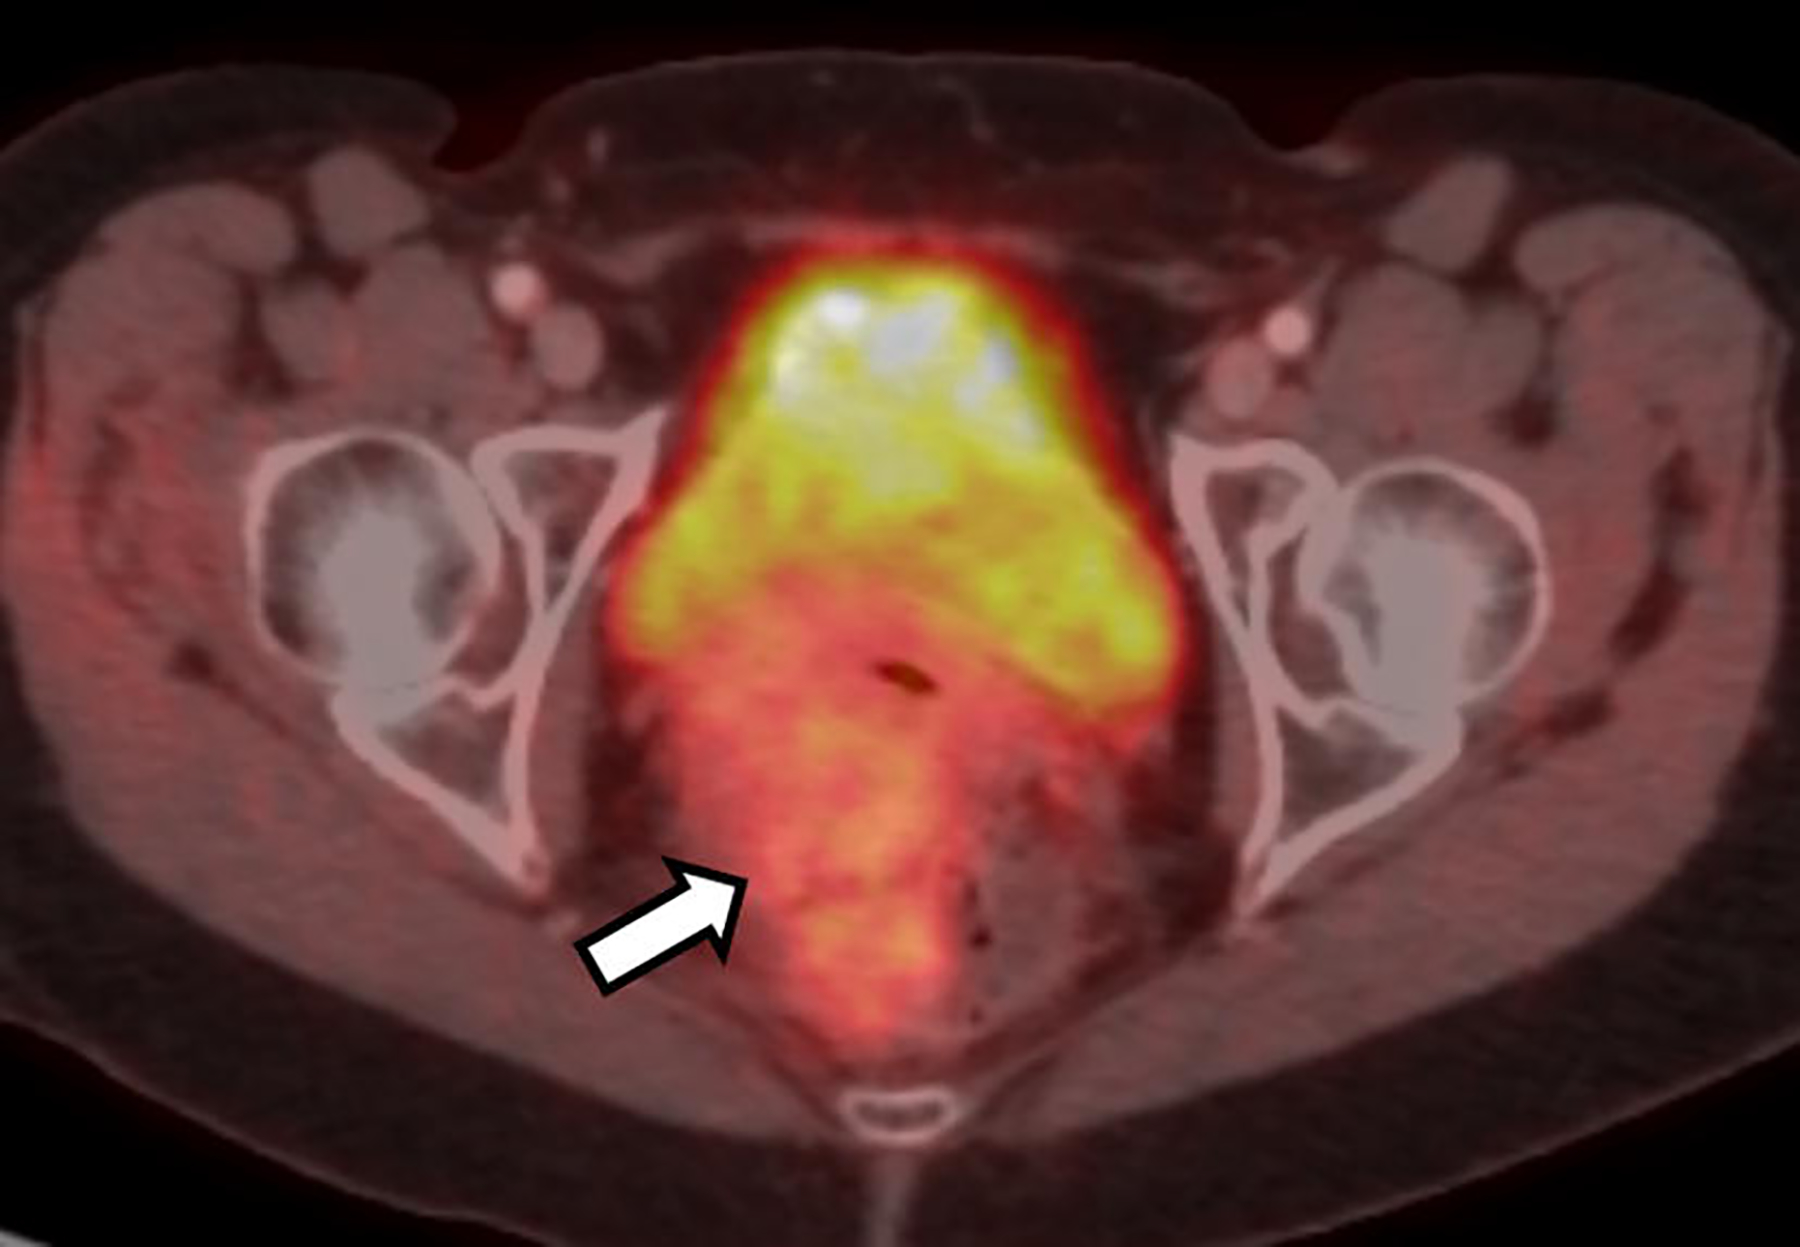
Fig. 7.

Axial fused FDG-PET/CT image demonstrated mildly increased radiotracer uptake (arrow) in the mass with a maximal SUV of 3.3 (measurement not shown). Note the normal intense radiotracer activity in the partially imaged bladder which corresponds to the excreted radiotracer
