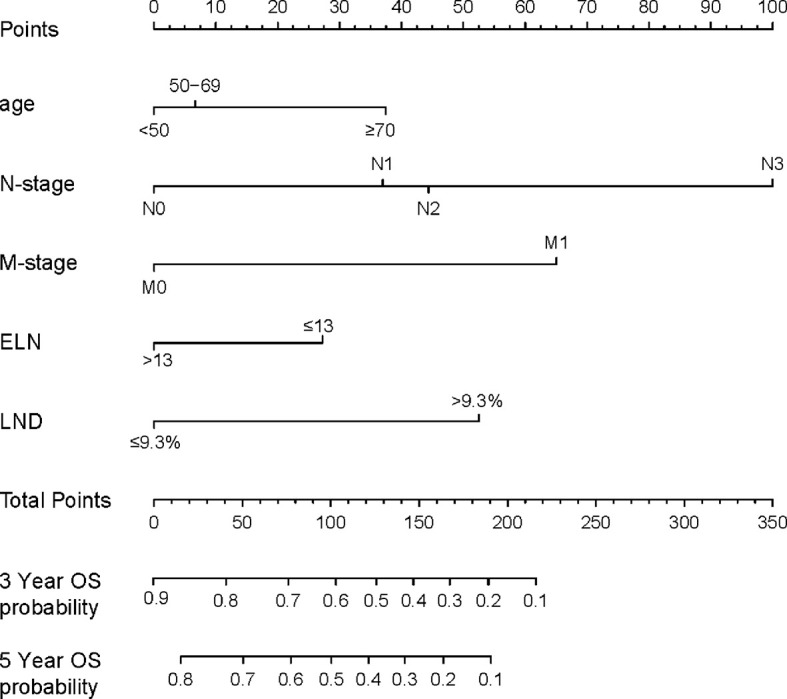
Figure 5.

A nomogram for predicting the OS. In order to use the nomogram, the value of each predicted value is determined by drawing a line up to the point reference line, these points are summed, and drawing a line down from the total point line to find the predicted probability of OS. OS, Overall survival; LND, Lymph node density; ELN, Examined lymph node.
