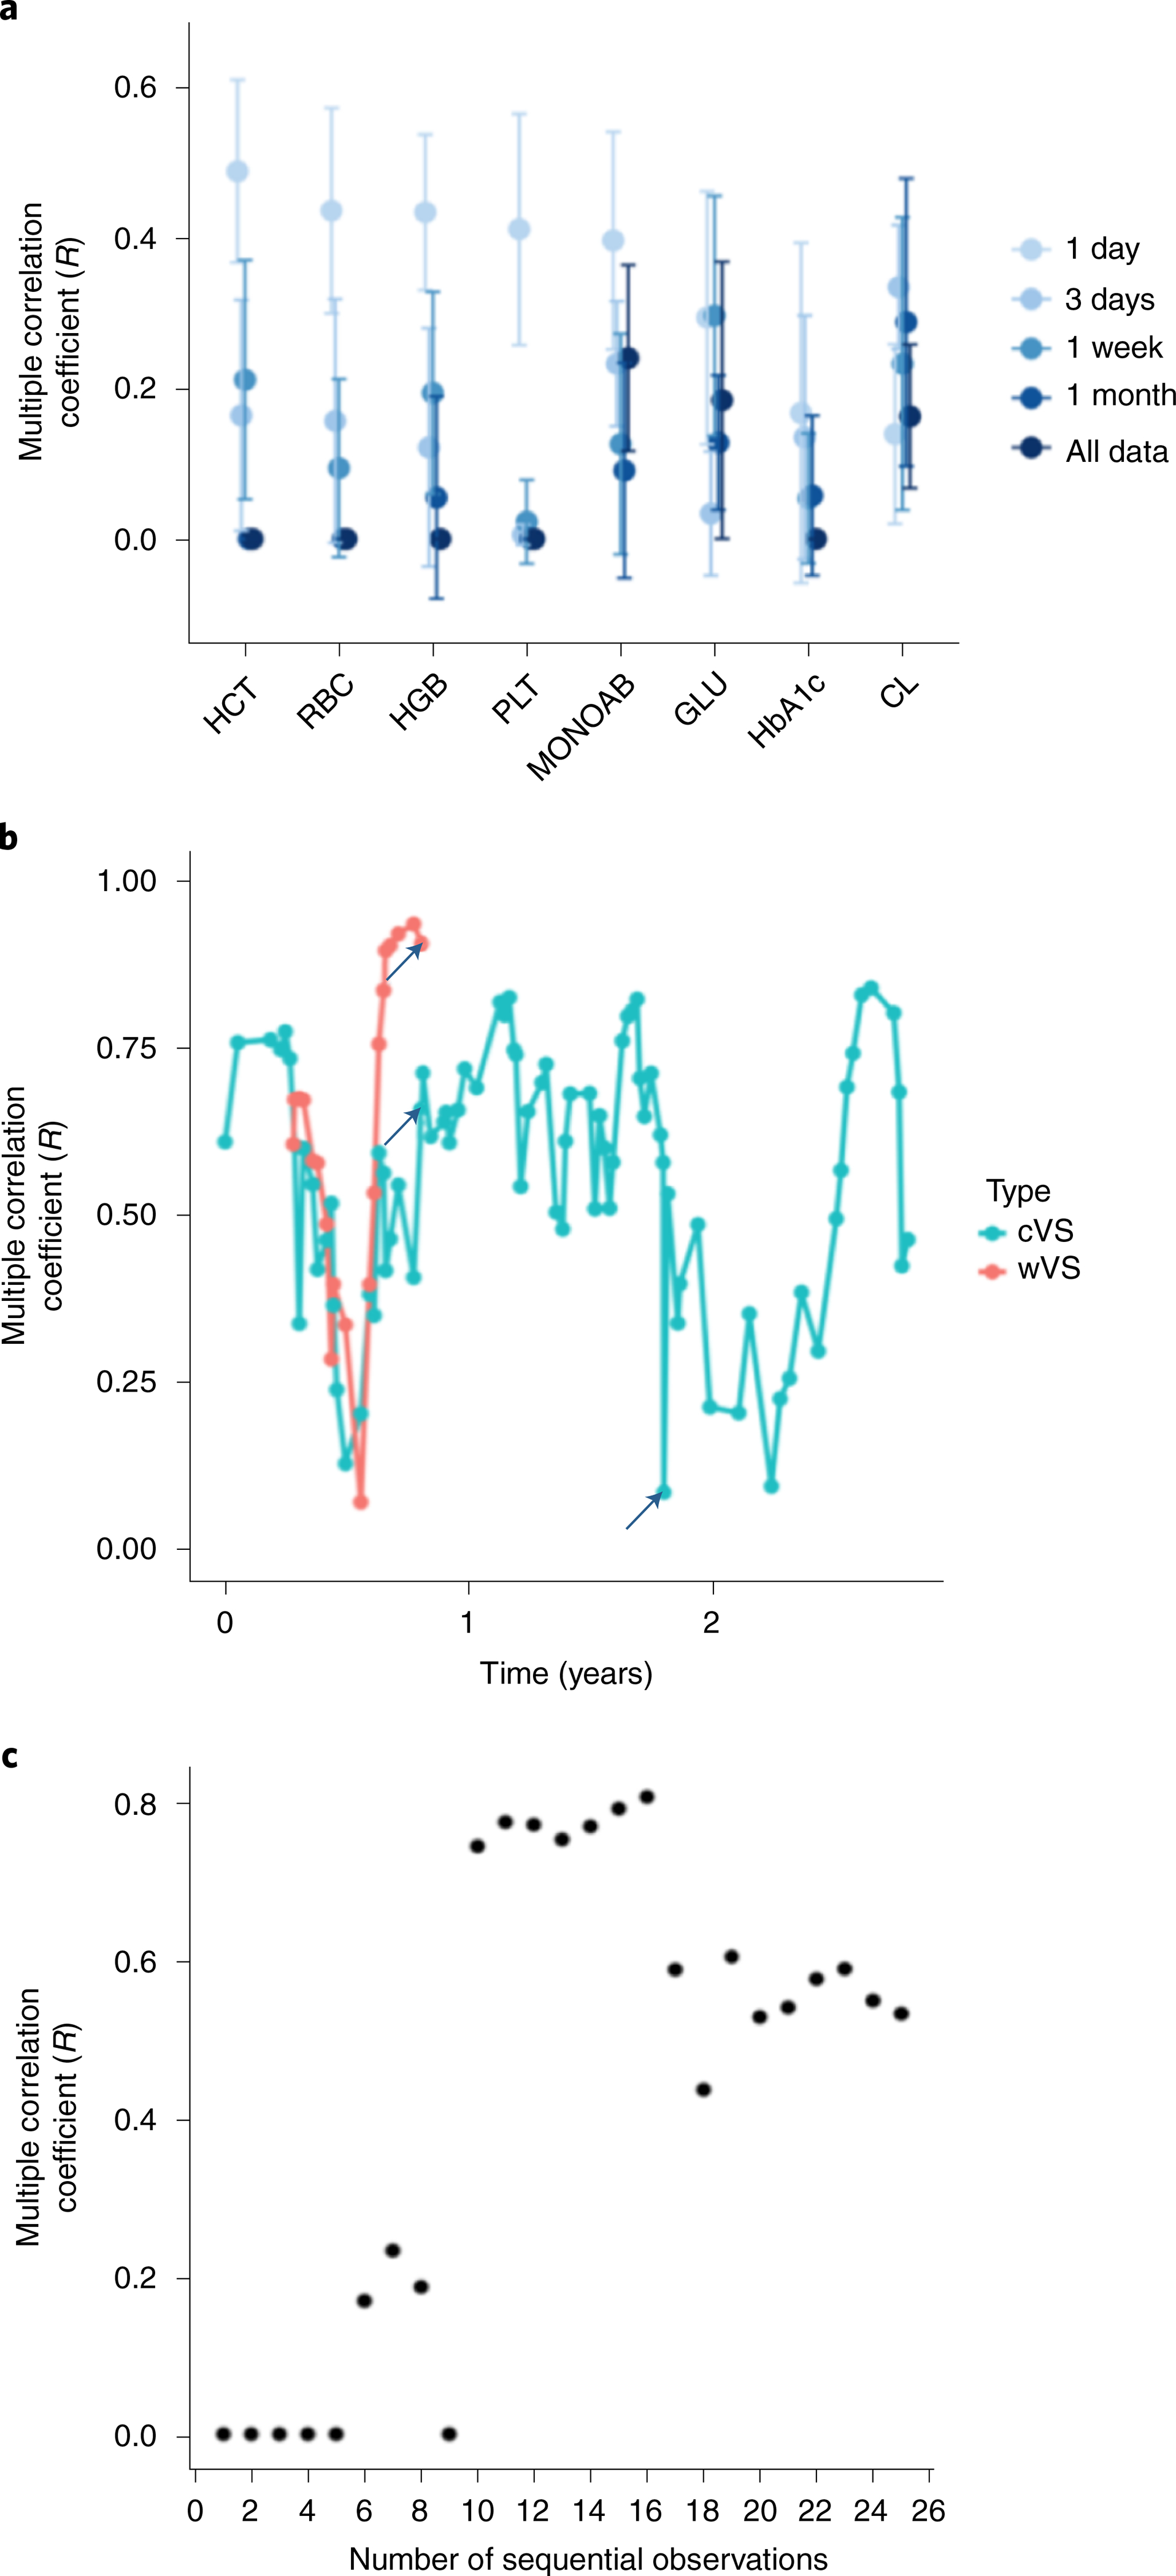
Fig. 4 |. Relationship between duration and proximity of monitoring and model accuracy.

a, The eight most accurate random forest models using varying time windows of wVS monitoring before the clinic test for calculating features as in Fig. 2a, and using leave-one-person-out cross validation for n = 54 study participants. Points correspond to the mean R statistic and error bars represent 95% confidence intervals derived by bootstrap with the procedure repeated 1,000 times. b, Multiple correlation coefficient (R) of the predicted versus observed values in the personal HCT cVS mixed effects model and wVS personal random forest model over time for the most frequently sampled iPOP study participant (a mainly healthy individual), with simultaneous smart watch monitoring and frequent clinic sampling over a 2.5-year period. The clinic visits demarcated with arrows correspond to a viral infection (left and middle arrows) and a traumatic biking accident resulting in an ED visit (right arrow). c, Accuracy (R) of the HCT ~ All Vitals model in the iPOP participant from part a versus the number of clinic visits that were used to develop the model.
