Figure 1.
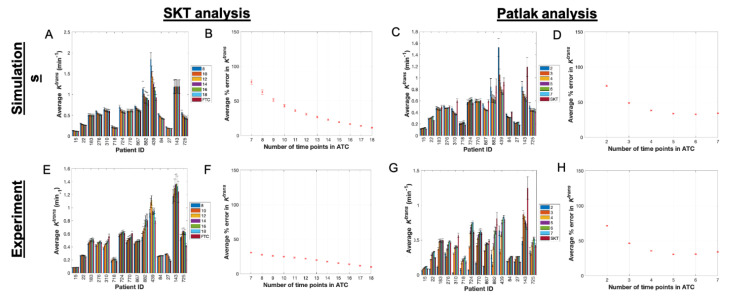
SKT and Patlak analysis of ACRIN-based simulated data and ACRIN clinical data. (A) Mean and 95% confidence intervals (CI) for simulated Ktrans values from the SKT model with the ATC length (denoted in legend) increasing from left to right in the bar plots for each patient (only a subset of all ATCs are displayed for simplicity in viewing). (B) Average percent error in Ktrans as a function of ATC length with 95% CIs. (C,D) present the analogous data for the Patlak analysis of the simulated data. The absolute error in (B,D) decreases as the ATCs are increased, but only up to a certain ATC in panel D at ATC6. (E) Mean and 95% confidence intervals (CI) for Ktrans values from analyzing the clinical data with the SKT model (only a subset of all ATCs are displayed for clarity). (F) Average percent error in Ktrans as a function of ATC length with 95% CIs. (G,H) present the analogous data for the Patlak analysis of the clinical data and, similar to (D), (H) shows the absolute error in Ktrans decreasing up to ATC5 before increasing again.

