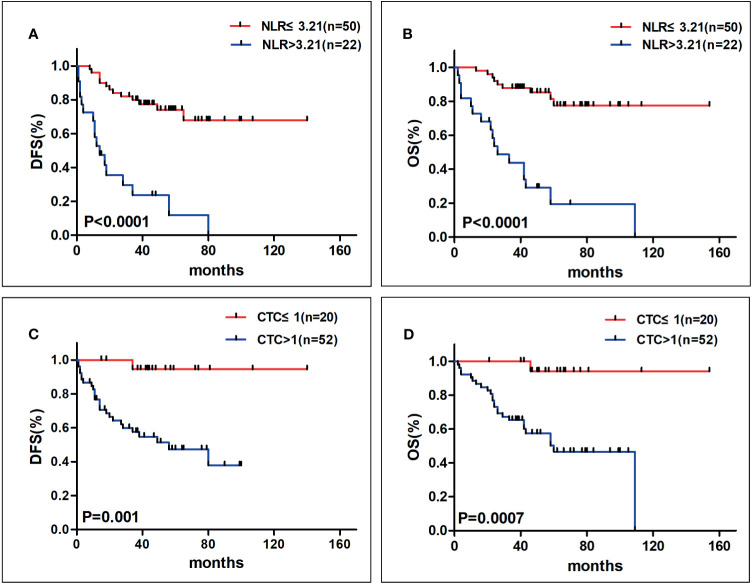
Figure 1.
The Kaplan–Meier analysis curves for NLR on DFS (A) and OS (B) and for CTCs on DFS (C) and OS (D) (DFS, disease-free survival; OS, overall survival; NLR, neutrophil–lymphocyte ratio; CTCs, circulating tumor cells). Patients in higher NLR group had poorer prognosis with shorter DFS and OS, meanwhile, patients with more CTCs tended to have worse clinical outcome with shorter DFS and OS.

