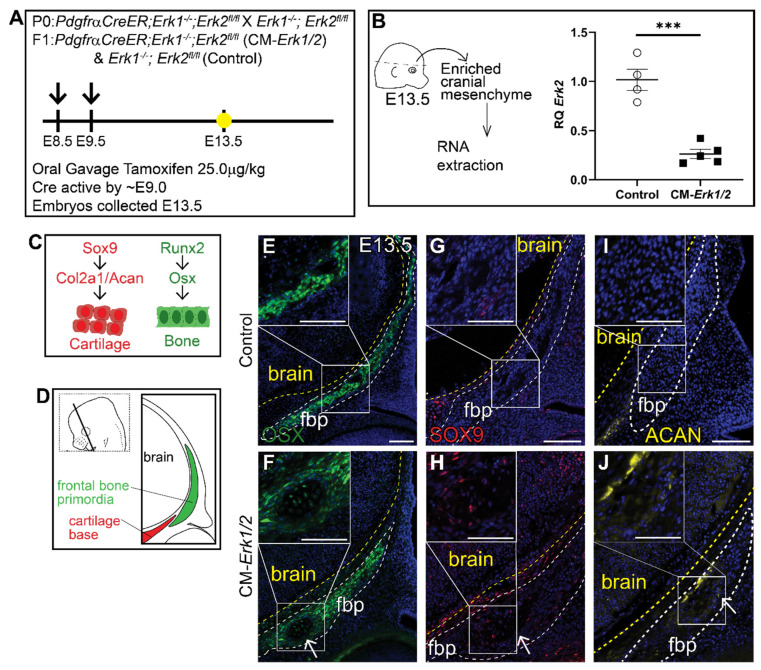
Figure 1.
Loss of ERK1/2 results in diminished expression of OSX, and ectopic expression of chondrocyte fate markers at E13.5. Schematic depicting the gavage regimen and timing of deletion of Erk2 (A). (B) Schematic depicting the work flow and tissue source for the RNA analysis, RT-qPCR analysis depicting the relative quantity of mRNA transcripts for Erk2 demonstrating deletion efficiency of gavage regimen. p(***) = 0.0002. Bone and cartilage cell fate and marker schematic (C) and orientation and plane of specimens (D). Immunofluorescence for calvarial progenitor marker, OSX (E,F), and chondrocyte markers, SOX9 (G,H) and Aggrecan (ACAN) (I,J) at E13.5. Arrows indicate ectopic cartilage formation. fbp, frontal bone primordia; n = 3–5.

