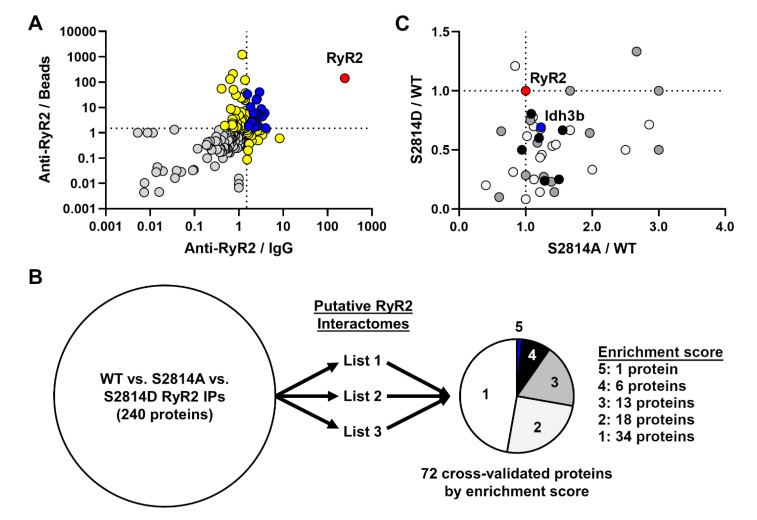
Figure 2.
Phosphorylation-dependent alterations in cardiac RyR2 interactome. (A) RyR2 interactome defined based on enrichment with RyR2 pull-down compared to IgG (anti-RyR2/IgG) and beads-only (anti-RyR2/Beads) pull-downs. Ratios for each identified protein were calculated based on label-free quantification (LFQ) intensities across samples which were run and analyzed in parallel. Dotted lines mark ratios of 1.5, above which there is considered enrichment with RyR2 pull-down. The bait protein RyR2 (red) is highly enriched in the pull-down. Blue marks proteins enriched in RyR2 pull-down with respect to both IgG and beads-only controls (22 proteins). Yellow marks proteins enriched in RyR2 pull-down with respect to either IgG (15 proteins) or beads-only control (42 proteins). (B) Cross-validation and prioritization of WT, S2814A, and S2814D RyR2 IPs using published (List 1) [8] and unpublished (Lists 2 [10] and 3) putative RyR2 interactomes. List 3 is the putative RyR2 interactome generated in this study (Table S1). Enrichment score calculation is described in the Results section. (C). Alterations in the RyR2 interactome based on the phosphorylation-mimic status at S2814. Ratios for each protein were calculated based on peptide spectrum matches (PSM) and plotted for S2814A mutant over WT (S2814A/WT) and S2814D mutant over WT (S2814D/WT). Dotted lines mark ratios of 1.0. Each protein was cross-validated against three RyR2 AP-MS experiments to generate an enrichment score (the higher the score, the more likely it is a true RyR2 interactor) with the maximum score being 6 (see panel B). White, grey, and black circles are proteins with a score of 2, 3, and 4, respectively. The blue circle marks the only protein with a score of 5 (Idh3b), whereas the red circle marks the bait protein RyR2.

