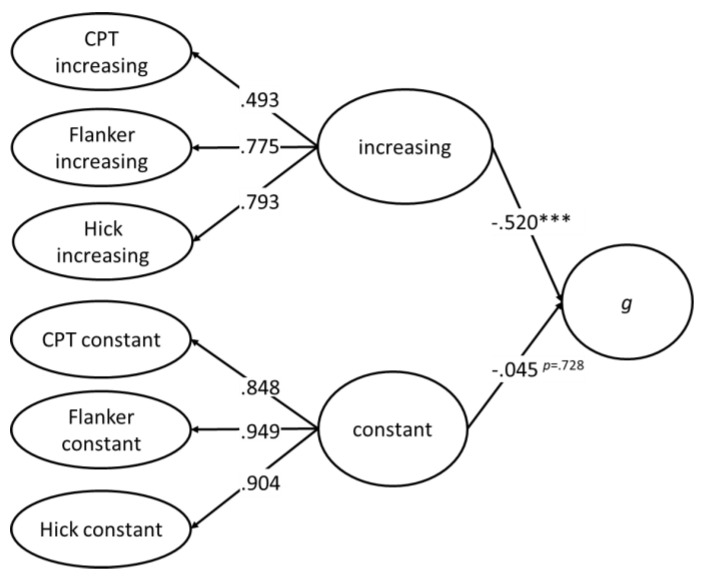
Figure 5.
Latent regression analysis of the relationship between the g factor and two second-order latent variables extracted from the flanker task, the continuous performance test (CPT), and the Hick task. Model fit: χ2SB(48) = 104.243; p < .001; CFIrob = .949; RMSEA = .072; SRMR = .056. *** p < .001.

