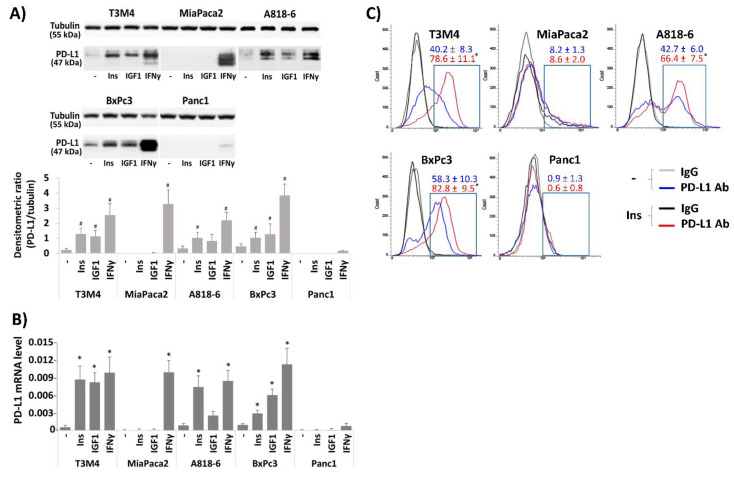
Figure 1.
Effect of Insulin and IGF on PD-L1 expression in PDAC cells. (A,B) the PDAC lines A818-6, T3M4, BxPc3, MiaPaca2, and Panc1 were kept at low FCS concentration (0.3% (v/v)) for 24 h. Then, cells were either left untreated or were treated for (A,C) 24 h and (B) 16 h with 0.1 IU/mL insulin, 0.1 µg/mL IGF1 or, for comparison, with 50 ng/mL IFNγ. (A) Western blot analysis using PD-L1 and Tubulin antibodies. Representative blots from four independent experiments and band densitometry analysis (lower panel, # p < 0.05 compared to untreated) are shown. (B) qPCR analysis using PD-L1 and RPL13 primers (the latter used as control). PD-L1 expression was normalized to the expression level of RPL13, and data represent the mean ± SD from four independent experiments (* p < 0.03 compared to untreated). (C) Non-permeabilized cells were immunostained with anti-PD-L1 or IgG control antibodies and analyzed by fluorescence flow cytometry. A representative result from four independent experiments is shown. The percentage of PD-L1 positive cells (boxed areas) are indicated (mean ± SD, * p < 0.05 compared to untreated).

