Figure 5.
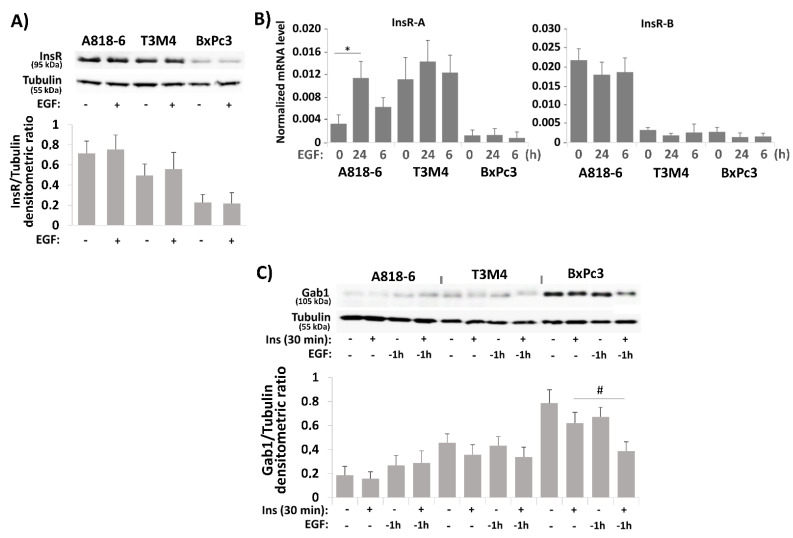
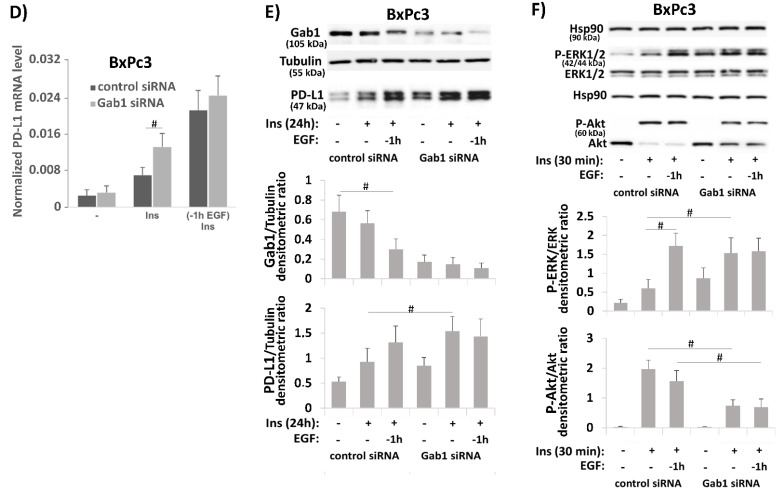
The effect of EGF on insulin-induced PD-L1 expression in PDAC cells involves different mechanisms. (A,B) Serum-starved A818-6, T3M4, and BxPc3 cells were either left untreated or treated with 10 ng/mL EGF for (A) 24 h or (B) 6 h and 24 h. (A) Western blot analysis using InsR and tubulin antibodies. (B) qPCR analysis using InsR-A, InsR-B, and RPL13 primers. InsR-A and InsR-B expression is normalized to the expression level of RPL13, and data represent the mean ± SD from four independent experiments (* p < 0.02 compared to untreated). (C) Serum-starved A818-6, T3M4, and BxPc3 cells were either left untreated or treated with 0.1 IU/mL insulin for 30 min either alone or after preincubation for the indicated periods with 10 ng/mL EGF. Then, Western blot analysis using Gab1 and tubulin antibodies was performed. (D–F) BxPc3 cells were treated with control or Gab1 siRNA for 24 h followed by serum starvation for 24 h. Then, cells either left untreated or were treatment with 0.1 IU/mL insulin for 16 h (D), 24 h (E) or 30 min (F) either in the absence or presence of 10 ng/mL EGF administered 1 h before. (D) qPCR analysis using PD-L1 and RPL13 primers. PD-L1 expression is normalized to the expression level of RPL13, and data represent the mean ± SD from four independent experiments (* p < 0.05). (E,F) Western blot analysis using (E) PD-L1, Gab1, and tubulin antibodies or (F) P-ERK1/2, ERK1/2, P-Akt, Akt, and Hsp90 antibodies. (A,C,E,F) Representative blots from four independent experiments and band densitometry analyses (lower panels, # p < 0.05, n = 4) are shown.


