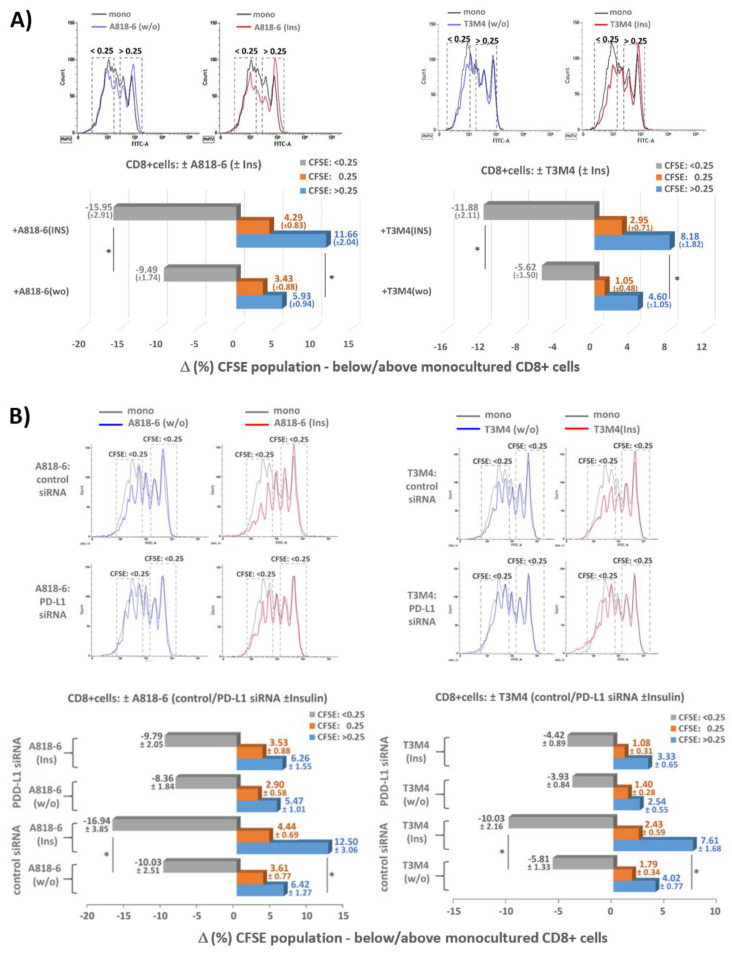
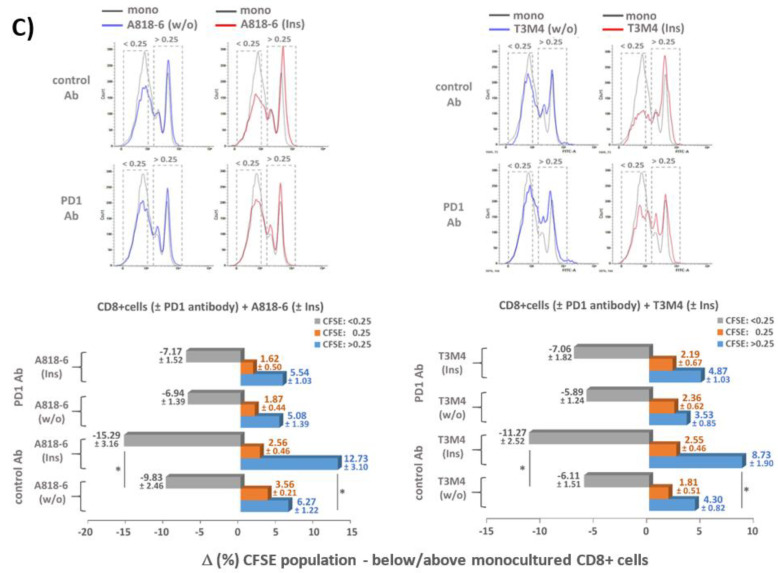
Figure 7.
Insulin-induced PD-L1 expression in PDAC cells suppresses proliferative activity of CD8+ T-cells. (A) 1 × 10⁵ serum-starved A818-6 and T3M4 cells were left untreated (w/o) or treated with 0.1 IU/mL insulin (Ins) for 24 h. Then, cells were cocultured with 250,000 CFSE labelled and preactivated human CD8+ T-cells. At a final FCS concentration of 1% (v/v), PDAC and CD8+ T-cells were cocultured for 72 h. In parallel, CD8+ T-cells were monocultured under the same conditions. Afterwards, CD8+ T-cells were collected and submitted to flow cytometry for quantification of CFSE staining intensity. (B) A818-6 and T3M4 cells were pretreated with control or PD-L1 siRNA for 24 h, followed by serum starvation and subsequent treatment with 0.1 IU/mL insulin (Ins) or without (w/o) for 24 h. Then, CD8+ T-cells co/monoculture and flow cytometry for quantification of CFSE staining intensity were performed as described above. (C) Serum-starved A818-6 and T3M4 cells were left untreated or treated with 0.1 IU/mL insulin for 24 h. Then, the PDAC cells were cocultured with CFSE labelled and preactivated human CD8+ T-cells pretreated for 1 h with 2.5 µg/mL of PD-1 antibody (Pembrolizumab) or control antibody (Human IgG4, kappa). CD8+ T-cells co/monoculture and flow cytometry for quantification of CFSE staining intensity were performed as above. (A–C) The bar diagrams represent the percent decrease (−%) or increase (+%) of the three CFSE staining intensity fractions (<0.25, 0.25, >0.25) compared to monocultured CD8+ T-cells. The intensity fractions are highlighted by the dashed boxes in the representative histograms depicted in the upper panels. Data represent the mean ± SD from four (A,B) and five (C) independent experiments, respectively, performed in duplicates; (* p < 0.05 compared to untreated).


