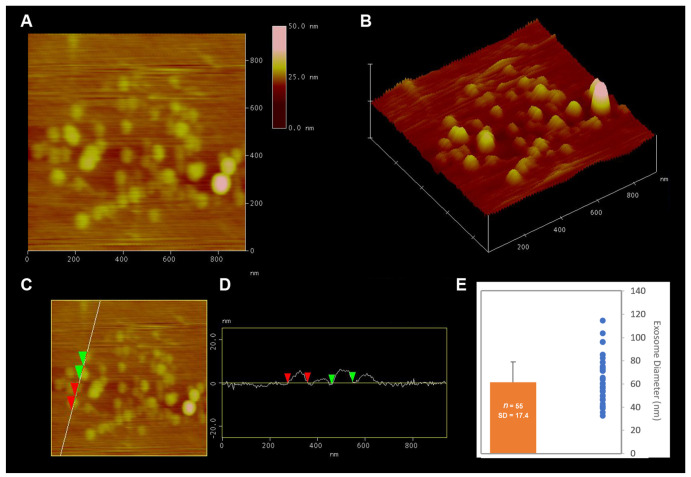
Figure 1.
Atomic force micrograph of isolated exosomes demonstrates a distribution of 30–115 nm and an average size of 60 nm. (A) AFM 2-D micrograph of isolated exosomes placed on mica. (B) AFM 3-D micrograph of the isolated exosomes in A. (C,D) Cross-section analysis of exosomes, and (E) Bar graph of exosome size and the size distributions to the right as dots.

