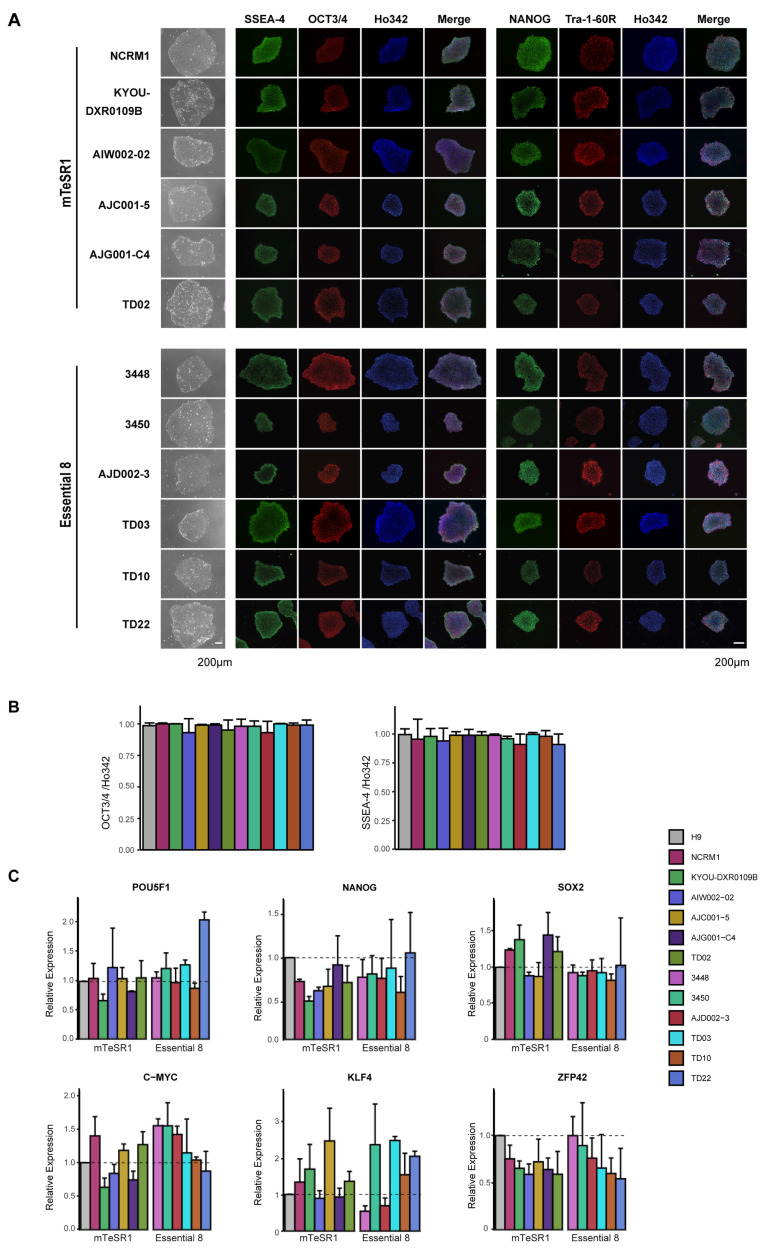
Figure 3.
Expression of pluripotency markers in hiPSCs. (A) Phase contrast images and ICC for pluripotency markers SSEA-4, OCT3/4, NANOG, and Tra-1-60, with Ho342 nucleic acid counterstain. (B) Quantification of OCT3/4-positive cells or SSEA-4-positive cells shown in (A). (C) qPCR for mRNA expression of pluripotency genes POU5F1, NANOG, c-MYC, KLF4, SOX2, and ZFP42 in hiPSCs compared to H9 ESCs. mRNA expression in H9 was set as 1.0. The mean and SD are from technical triplicates from three independent experiments.

