Figure 4.
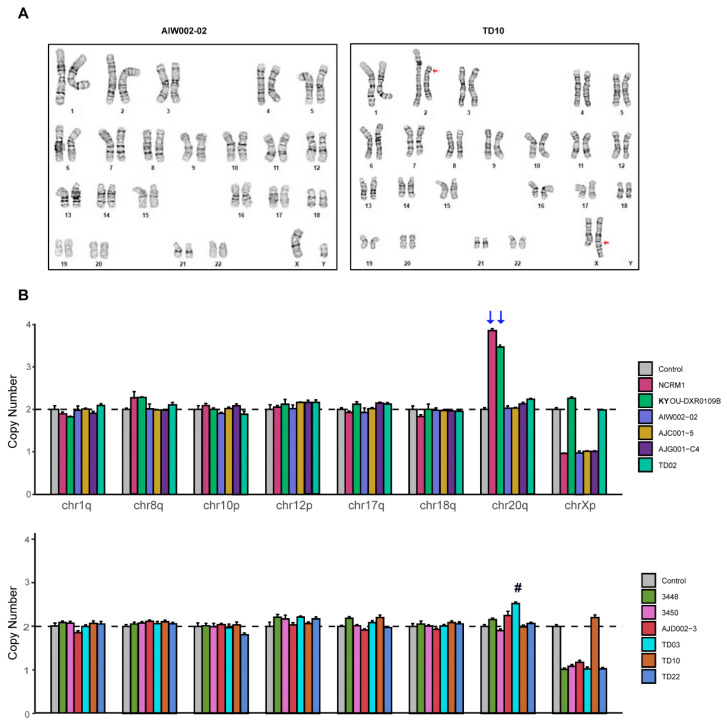
Genomic integrity analysis of hiPSCs. (A) Karyotyping and G-band analyses showing examples of one normal (left) and one abnormal hiPSC karyotype (right). An apparently balanced translocation between the long (q) arm of chromosome X and the short (p) arm of chromosome 2 is present in TD10 (red arrow). (B) qPCR-based genetic analysis to detect small chromosome abnormalities in all hiPSC lines. The copy numbers of chr1q, chr8q, chr10p, chr12p, chr17q, chr18q, chr20q, and chrXp were normalized to chr4p expression set at 2. Error bars show standard deviation from technical triplicates from two independent experiments. There are no abnormalities within critical regions in our cell lines, while NCRM1 and KYOU-DXR0109 have amplification of chr20q (indicated by blue arrows). TD03 shows a slight increase in chr20q (indicated with #), however this is not above the threshold of expected variation.

