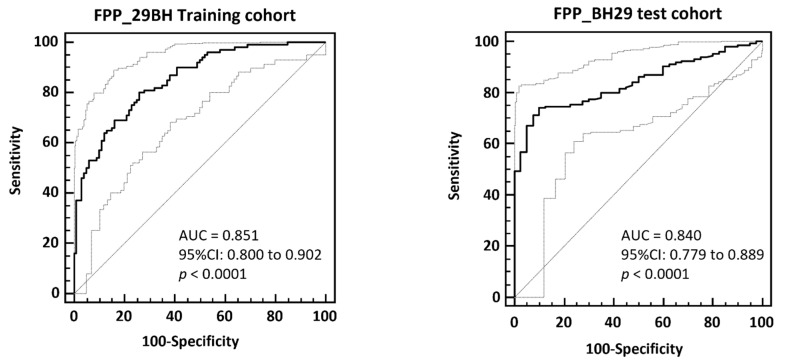
Figure 2.
ROC-analysis of FPP_BH29 classifier applied to total cross-validated training data (left) and to an independent test set composed of patients with IFTA < 10% and IFTA ≥ 15 (right). In the bottom right corner of the graph area under the ROC curve (AUC), 95% confidence intervals and significance levels (p < 0.001) are given.

